
How to Find the Right Financial Advisor When You've Been Disappointed Before
Most disappointing advisor relationships aren't about bad actors. They're about advisors who managed investments but never built an actual written plan. Here's how to tell the difference between the wrong advisor and simply the wrong fit.

Someone recently described the search for a good financial advisor as trying to find a dolphin in a sea of sharks. It is a memorable way to put it, and if you have hired an advisor before and come away underwhelmed, it probably lands.
Here is what I would gently offer, though. When people tell me about the advisors who disappointed them, the story is rarely about a shark. It is not usually that someone was dishonest or out to take advantage. It is that the advisor did not add enough value, or was not the right match for their situation, or simply was not that strong at the work. Those are valid frustrations. They are also a different problem than the metaphor suggests, and the difference matters, because it changes what you are looking for. This lines up with the research, too. When Morningstar asked investors who had left an advisor why they did it, the reasons they gave most often were the quality of the advice and the quality of the relationship, not investment performance [1].
If the problem were sharks, your job would be to spot the predator. But if the people who let you down were honest and just not a fit, then you are not hunting for the rare good one in dangerous water. You are screening for the specific advisor whose focus lines up with your life. That is a much more solvable search, and it helps to be clear about how to run it.
What sets the best advisors apart
A quick note on where I am coming from, because it shapes how I think about this. Alongside working with my own clients, I do contracted planning work for other advisors, which means I have seen the actual planning output behind dozens of practices. They are not all the same. And much of what separates the strongest advisors from the rest is not charisma, or a confident market call, or a good story. It tends to come down to whether there is a detailed analysis and a completed written plan, with concrete action items that move your situation forward.
That is the part a lot of people have never actually experienced. When I ask someone whether a past advisor built them a written financial plan (not a portfolio, not a product, a plan), the answer is often no. If that is your history, it is possible you have not yet tried the thing that tends to deliver the value you were hoping for. You may have been sampling investment managers while hoping to end up with a planner. Those are not the same job.
Types of advisors you might meet
It helps to separate the advisor you should avoid from the three other situations people tend to lump in with them, because they call for different responses.
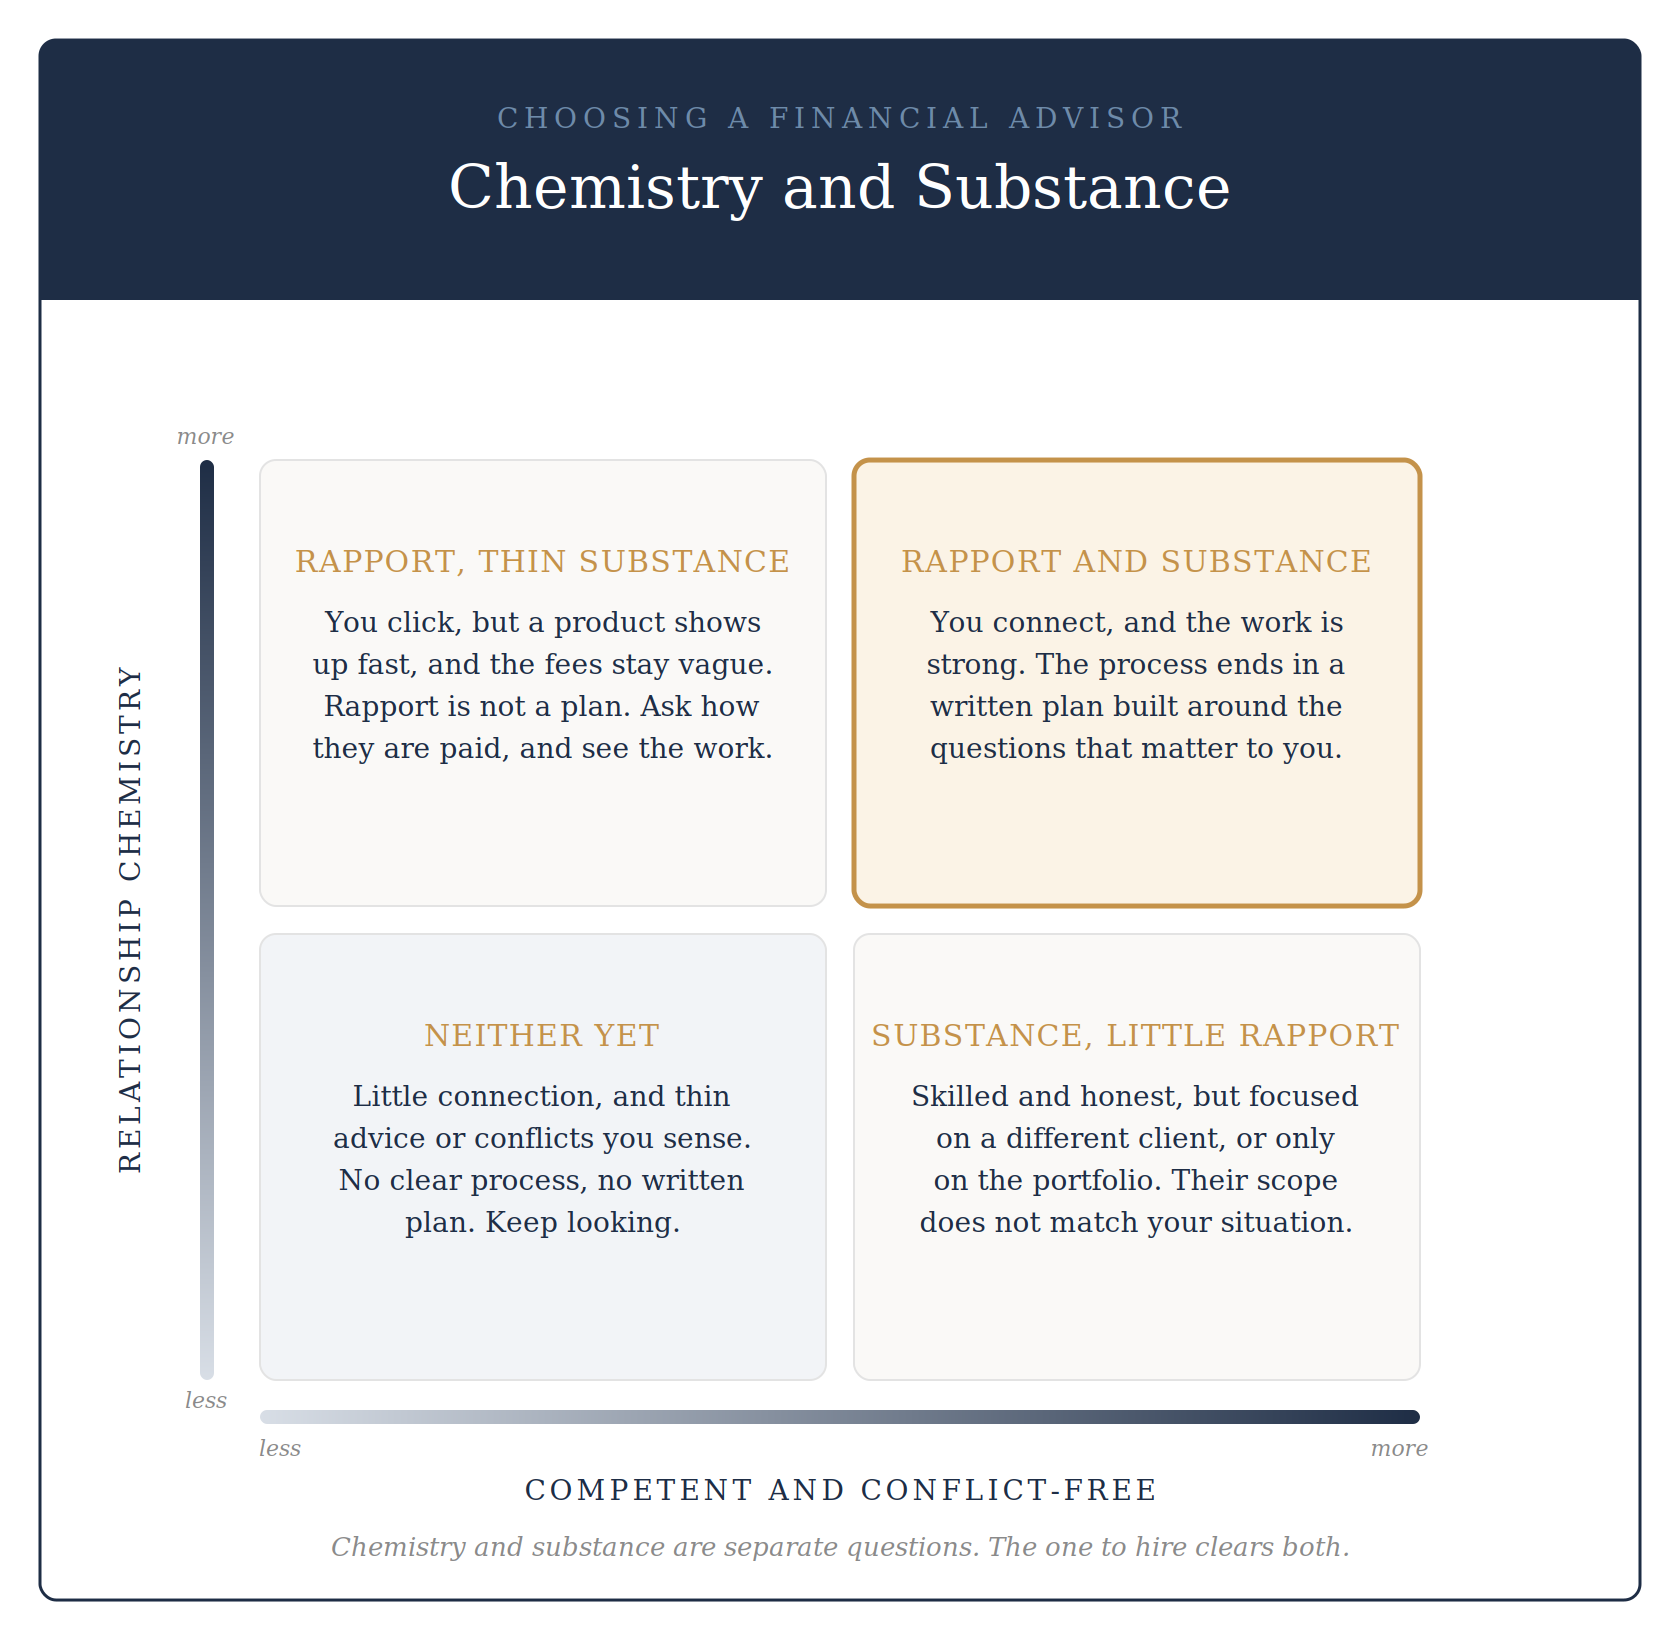
The one to avoid usually gives themselves away through structure, not dishonesty. Watch how they are paid, and how quickly a product enters the conversation. If the first answer for most people who walk in is a commission-based annuity, insurance policy, or REIT, that is a reason to slow down. Those tools can fit when a plan calls for them. They just should not be the default answer for everyone. Vague fees and an inability to describe their own process belong here too.
The ethical, competent advisor who will not add enough value for you often does solid investment management and stops there. If your situation is layered (taxes, equity compensation, a pension option election, business income), someone who only manages portfolios cannot reach far enough to help. Nothing is wrong with them. Their scope just does not match your needs.
The excellent advisor who is not your fit tends to specialize in a different kind of client, or to communicate on a different wavelength than the one you want. They may be very good at what they do. It just does not map onto the decisions in front of you.
The advisor who is likely to be exceptional for you is the one whose process ends in that written plan, who asks about your life before recommending anything, and whose focus lines up with your actual questions. Here is the single most useful screening move: ask an advisor to describe their ideal client, and who they are not a good fit for. The strong ones will happily tell you. That willingness to send you elsewhere is one of the better signals you will get.
What to look for, and what to avoid
The signals I trust most: a fee-only fiduciary, in writing, not just when it happens to be convenient. An advisor who asks far more than they tell in a first meeting, and who is curious about your goals and worries before mentioning a product. A defined process that ends in a written plan with concrete next steps, not just an account statement. Someone who can explain how they add value beyond returns, and who will coordinate with (or even help you find) your CPA and attorney rather than staying narrowly in their lane.
The warning signs, whether they point to mediocre or simply a poor fit: product and performance talk in the first conversation, dodging the “how do you get paid” question, one portfolio that somehow suits everybody, no written plan at all, urgency, and talking more than listening. None of those require bad intent. They just tend to predict disappointment.
What to stop focusing on, and what to watch instead
If I could change one habit, it would be the focus on performance and past returns. When you ask people why they hired an advisor in the first place, beating the market is rarely the reason. In that same Morningstar research, return performance accounted for only about 11% of the reasons people gave for leaving an advisor [1]. It is not reliably repeatable either, and using it as your scorecard sets you up to be unimpressed by good advisors and dazzled by ones who simply rode a rising market.
Two things deserve more of your attention, and the usual online checklists tend to skip both. First, whether this person will build you an actual written plan and help coordinate your whole financial picture, rather than sell you one slice of it. Second, whether you trust them to help you stay steady in a frightening market. A checklist can confirm that someone is a fiduciary and how they charge. It cannot tell you whether this is the person who helps you hold the line in the next downturn, which is one of the places the value lives.
Where to go from here
If you are weighing a few advisors right now, try this: ask each of them to walk you through their planning process, and to show you what a finished plan actually looks like. How they answer will tell you a lot, and it moves the conversation off performance and onto the work that tends to matter. If you would like to see what that kind of process looks like up close, I would be glad to walk you through how I approach it, and what a finished plan tends to include.
Sources
[1] Danielle Labotka and Samantha Lamas, “Why Do Investors Fire Their Financial Advisor?” Morningstar, 2023.
Disclosures
The views and opinions reflected in the content are subject to change at any time without notice. The content speaks only as of the date indicated. Some information was obtained from external sources. The information is believed to be accurate, but there is no guarantee that it is.
This content is for educational purposes only and does not constitute personalized tax, legal, or investment advice. Consult a qualified CFP®, CPA, or attorney before taking action.
Fiduciary Financial Advisors is a registered investment adviser. Nothing here constitutes individualized investment advice. Examples are illustrative only and not recommendations. No guarantee of future results. Third-party data is not independently verified.
CFP® and CERTIFIED FINANCIAL PLANNER® are certification marks owned by the CFP Board.

The CalPERS Financial Blueprint
Planning around a CalPERS pension works differently than private-sector retirement. The CalPERS Financial Blueprint is a free seven-step guide for California public employees, covering how much you need to save, how to use Savings Plus, when to time your exit, and the pension elections you cannot undo. Download it and see where your plan stands.
SEVEN STEPS to make the most of your pension, your savings, and the decisions in between
Here’s a sneak peak of what’s inside:
Step 1. Know your number
Step 2. Where that income comes from
Step 3. The election you cannot take back
Step 4. Time your exit
Step 5. Build what the pension does not cover
Step 6. Invest it well
Step 7. Do it yourself, or get help
Bonus. Common missteps

Disclosures
Fiduciary Financial Advisors does not accept any liability for the use of the information discussed. Consult with a qualified financial, legal, or tax professional prior to taking any action. Before investing, consider investment objectives, risks, fees, and expenses. Investments in securities involve the risk of loss, including loss of principal. Past performance is no guarantee of future returns. The views and opinions reflected in the content are subject to change at any time without notice. The content speaks only as of the date indicated. Some information was obtained from external sources. The information is believed to be accurate, but there is no guarantee that it is.
This content is for educational purposes only and does not constitute personalized tax, legal, or investment advice. Consult a qualified CFP®, CPA, or attorney before taking action.
Fiduciary Financial Advisors is a registered investment adviser. Nothing here constitutes individualized investment advice. Examples are illustrative only and not recommendations. No guarantee of future results. Third-party data is not independently verified.
CFP® and CERTIFIED FINANCIAL PLANNER® are certification marks owned by the CFP Board.
CalPERS Retirement Payment Options
A framework for the one CalPERS decision you can't take back, how to weigh the Unmodified Allowance against Options 1-4, and protect a survivor's income and health coverage.
Unmodified Allowance vs. Options 1-4 and How to Think About Survivor Benefits
Most of the decisions you make on the way to retirement can be revisited. You can change how much you put into Savings Plus. You can adjust your investment mix. You can move your retirement date if the math looks better.
The retirement payment option you select on your application works differently. You choose it once, it takes effect when your first check is issued, and outside of a short list of qualifying life events, it stays in place for the rest of your life and your beneficiary’s life. There are ways to change it later, but they are narrow, they are defined in advance, and which ones are open to you depends on the option you picked to begin with. This is one of the few CalPERS decisions I’d tell a client to slow down on.
If you work for SMUD, this applies to you the same way it applies to a state employee in Sacramento. SMUD contracts with CalPERS and contributes on behalf of eligible employees [11], so SMUD retirees make the same irrevocable election on the same application.
What the Option Election Involves
Every option other than the Unmodified Allowance involves the same type of trade-off. You accept a smaller monthly allowance during your lifetime in exchange for something continuing after your death.
The size of that reduction is not a fixed percentage. It depends on your age, your beneficiary’s age, both life expectancies, and how much you have contributed to the plan [1]. A member naming a spouse ten years younger may see a larger reduction than a member naming a spouse of the same age, because CalPERS expects to pay the continued benefit for longer [13].
What you are really doing is shifting income out of your own lifetime and into a joint one, and CalPERS prices that shift to be actuarially close to neutral. So the useful question isn’t whether the trade is a good deal in the abstract. It’s whether this particular income pattern fits for your situation.
The Current Option Menu
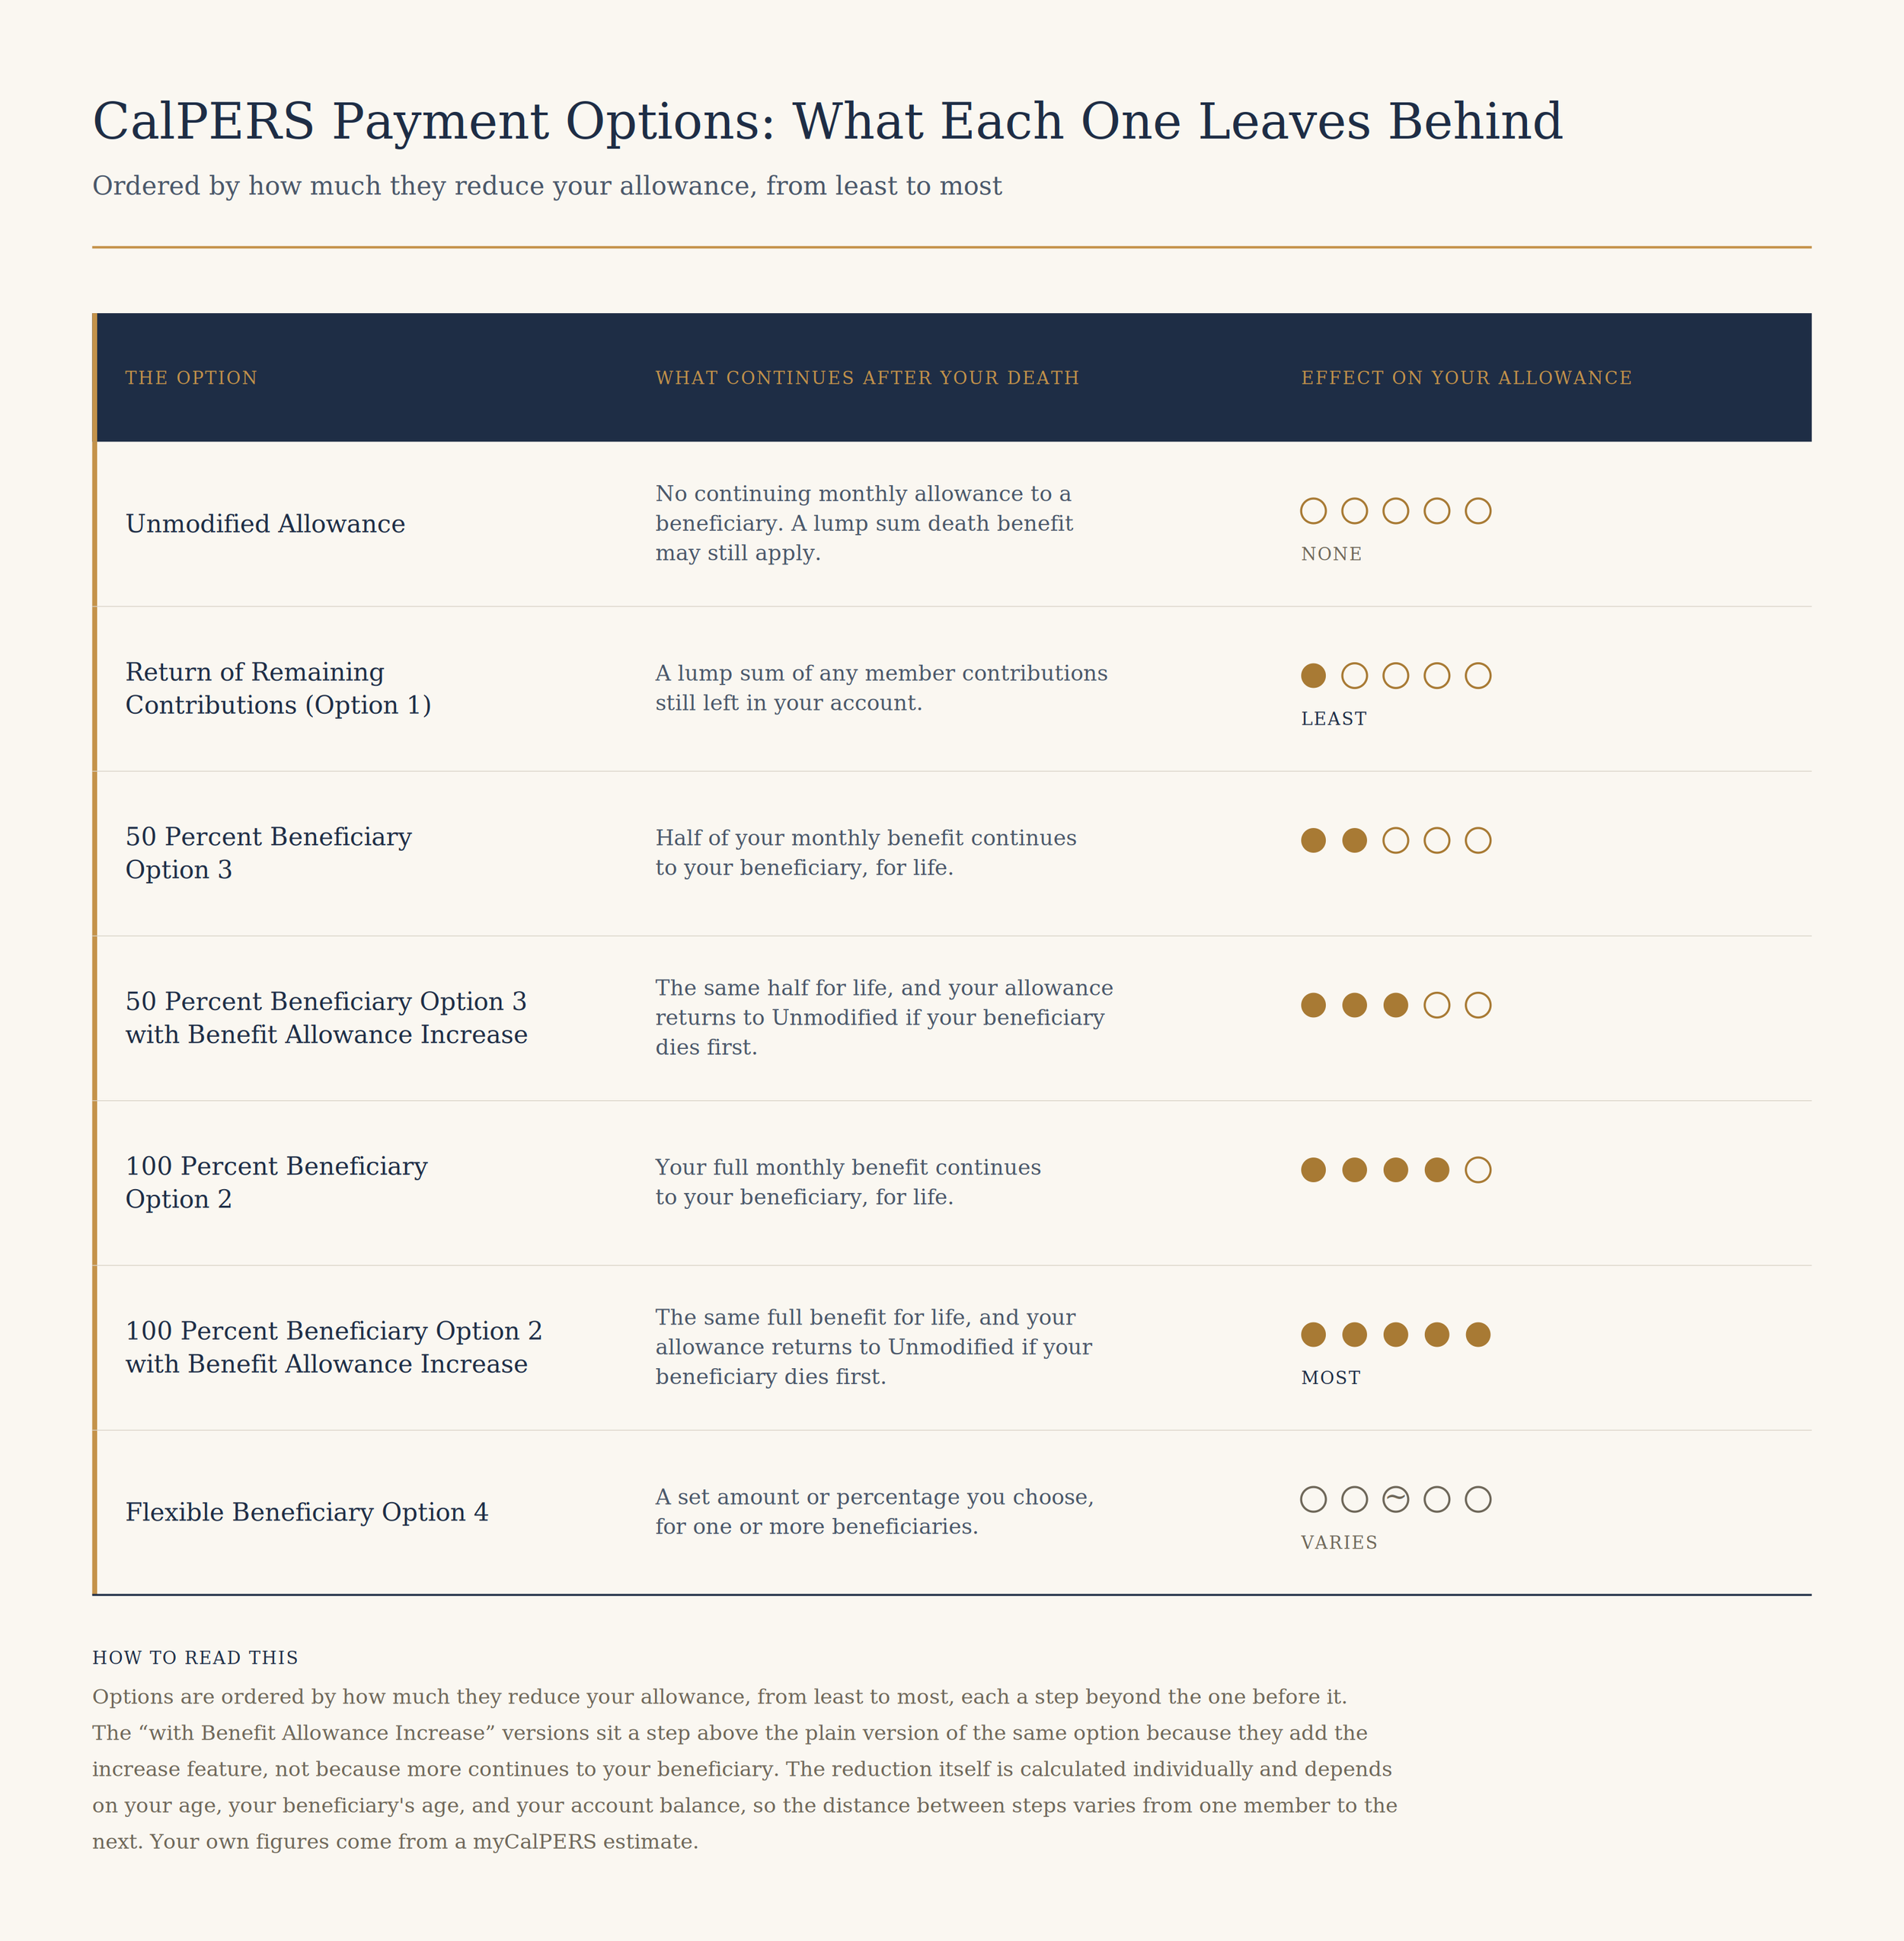
The “Options 1 through 4” language most people have heard describes the system through the end of 2017. The Retirement Option Simplification (AB 2404) consolidated and renamed the options for anyone retiring on or after January 1, 2018 [2][3]. If you are retiring now, the current menu runs from the Unmodified Allowance (the largest payment to you) through Option 1, the 50 and 100 percent beneficiary options and their Benefit Allowance Increase variants, to the Flexible Option 4 [1][2].
Two features of that menu may cause some confusion. The “with Benefit Allowance Increase” versions, which older members and some HR staff still call the pop-up, cost more than the plain version and buy one thing: if your beneficiary dies before you, your allowance climbs back to the Unmodified amount instead of staying reduced [1]. And the Flexible Beneficiary Option 4, despite the name, is not an open drafting tool; it lets you name a set dollar amount or percentage for one or more people, and the available forms are fixed [2][3][4].
A Word on Option 1
Return of Remaining Contributions looks like a low-cost middle ground, and the reduction is smaller than some of the other options. The catch is the word “remaining.” Your contributions are drawn down as your allowance is paid, and CalPERS states in its own retiree materials that in most cases nothing remains after roughly ten years of retirement, at which point Option 1 pays your beneficiary nothing while your allowance stays permanently reduced [7]. Think of it as protection against dying early in retirement rather than a way to leave an estate, and it tends to lose value the longer you live. If your goal is really to leave something behind, that’s usually a balance-sheet conversation rather than a pension-election one. (Separately, a small lump sum Retired Death Benefit, from $500 to $5,000 depending on your employer’s contract, is payable under any option and carries its own beneficiary designation you can update anytime [7].)
Survivor Continuance and How It Interacts With Your Election
This benefit sits outside the option election, and it may change the analysis.
Some CalPERS employers contract for a benefit called Survivor Continuance. Where/when it applies, an eligible survivor receives a continuing monthly allowance after your death regardless of which payment option you elected, including the Unmodified Allowance [6]. The amount is generally one half of your Unmodified Allowance if you were not covered by Social Security in your CalPERS service, one quarter if you were, and somewhere between the two if you were covered for part of your career [5].
The continuance and the option benefit are separate portions: elect a beneficiary option and your survivor may receive both, which together could end up equaling what you were receiving [5].
One practical planning nuance: because they are separate, they don’t have to be the same; you can name a child as your option beneficiary while your spouse independently qualifies for the continuance [5]. Two things CalPERS doesn’t spell out are ones to ask about against your own estimate: who exactly qualifies as an eligible survivor (the definition turns on the relationship and how long it has existed), and whether the option reduction is figured on your full Unmodified Allowance or only on the portion above the continuance, which changes the math [5]. Whether your employer contracts for this benefit at all is a fact about your employer, so confirm it in writing before you file.
I get into why this matters for the actual decision in the framework below. For now, the thing to hold onto is that the continuance can act as a floor under the whole election, even if you go with the unmodified allowance.
Retiree Health Coverage for a Surviving Spouse
For a lot of households, this could matter more than the monthly dollars.
Where retiree health coverage runs through CalPERS, a surviving spouse or partner generally keeps that coverage only if they were an eligible dependent at the time of death and they receive a continuing monthly check, either a Survivor Continuance or a monthly benefit from the option you elected [7][9]. CalPERS states the point directly for members who marry after retirement: if you want a new spouse or domestic partner to be eligible for continued health or dental coverage upon your death, you have to choose an option that provides them an ongoing monthly benefit [7]. If neither applies, coverage typically ends, and the survivor may instead be temporarily eligible for COBRA, which depends on certain qualifying events, rather than continuing retiree coverage [6].
If you’re a SMUD retiree, check this separately. SMUD runs its own retiree medical plans and contributes toward premiums on its own schedule [12], so the rule lives in SMUD’s plan documents rather than the CalPERS health program. The question you’re asking is the same; the place you find the answer is different.
What You Can and Cannot Change Later
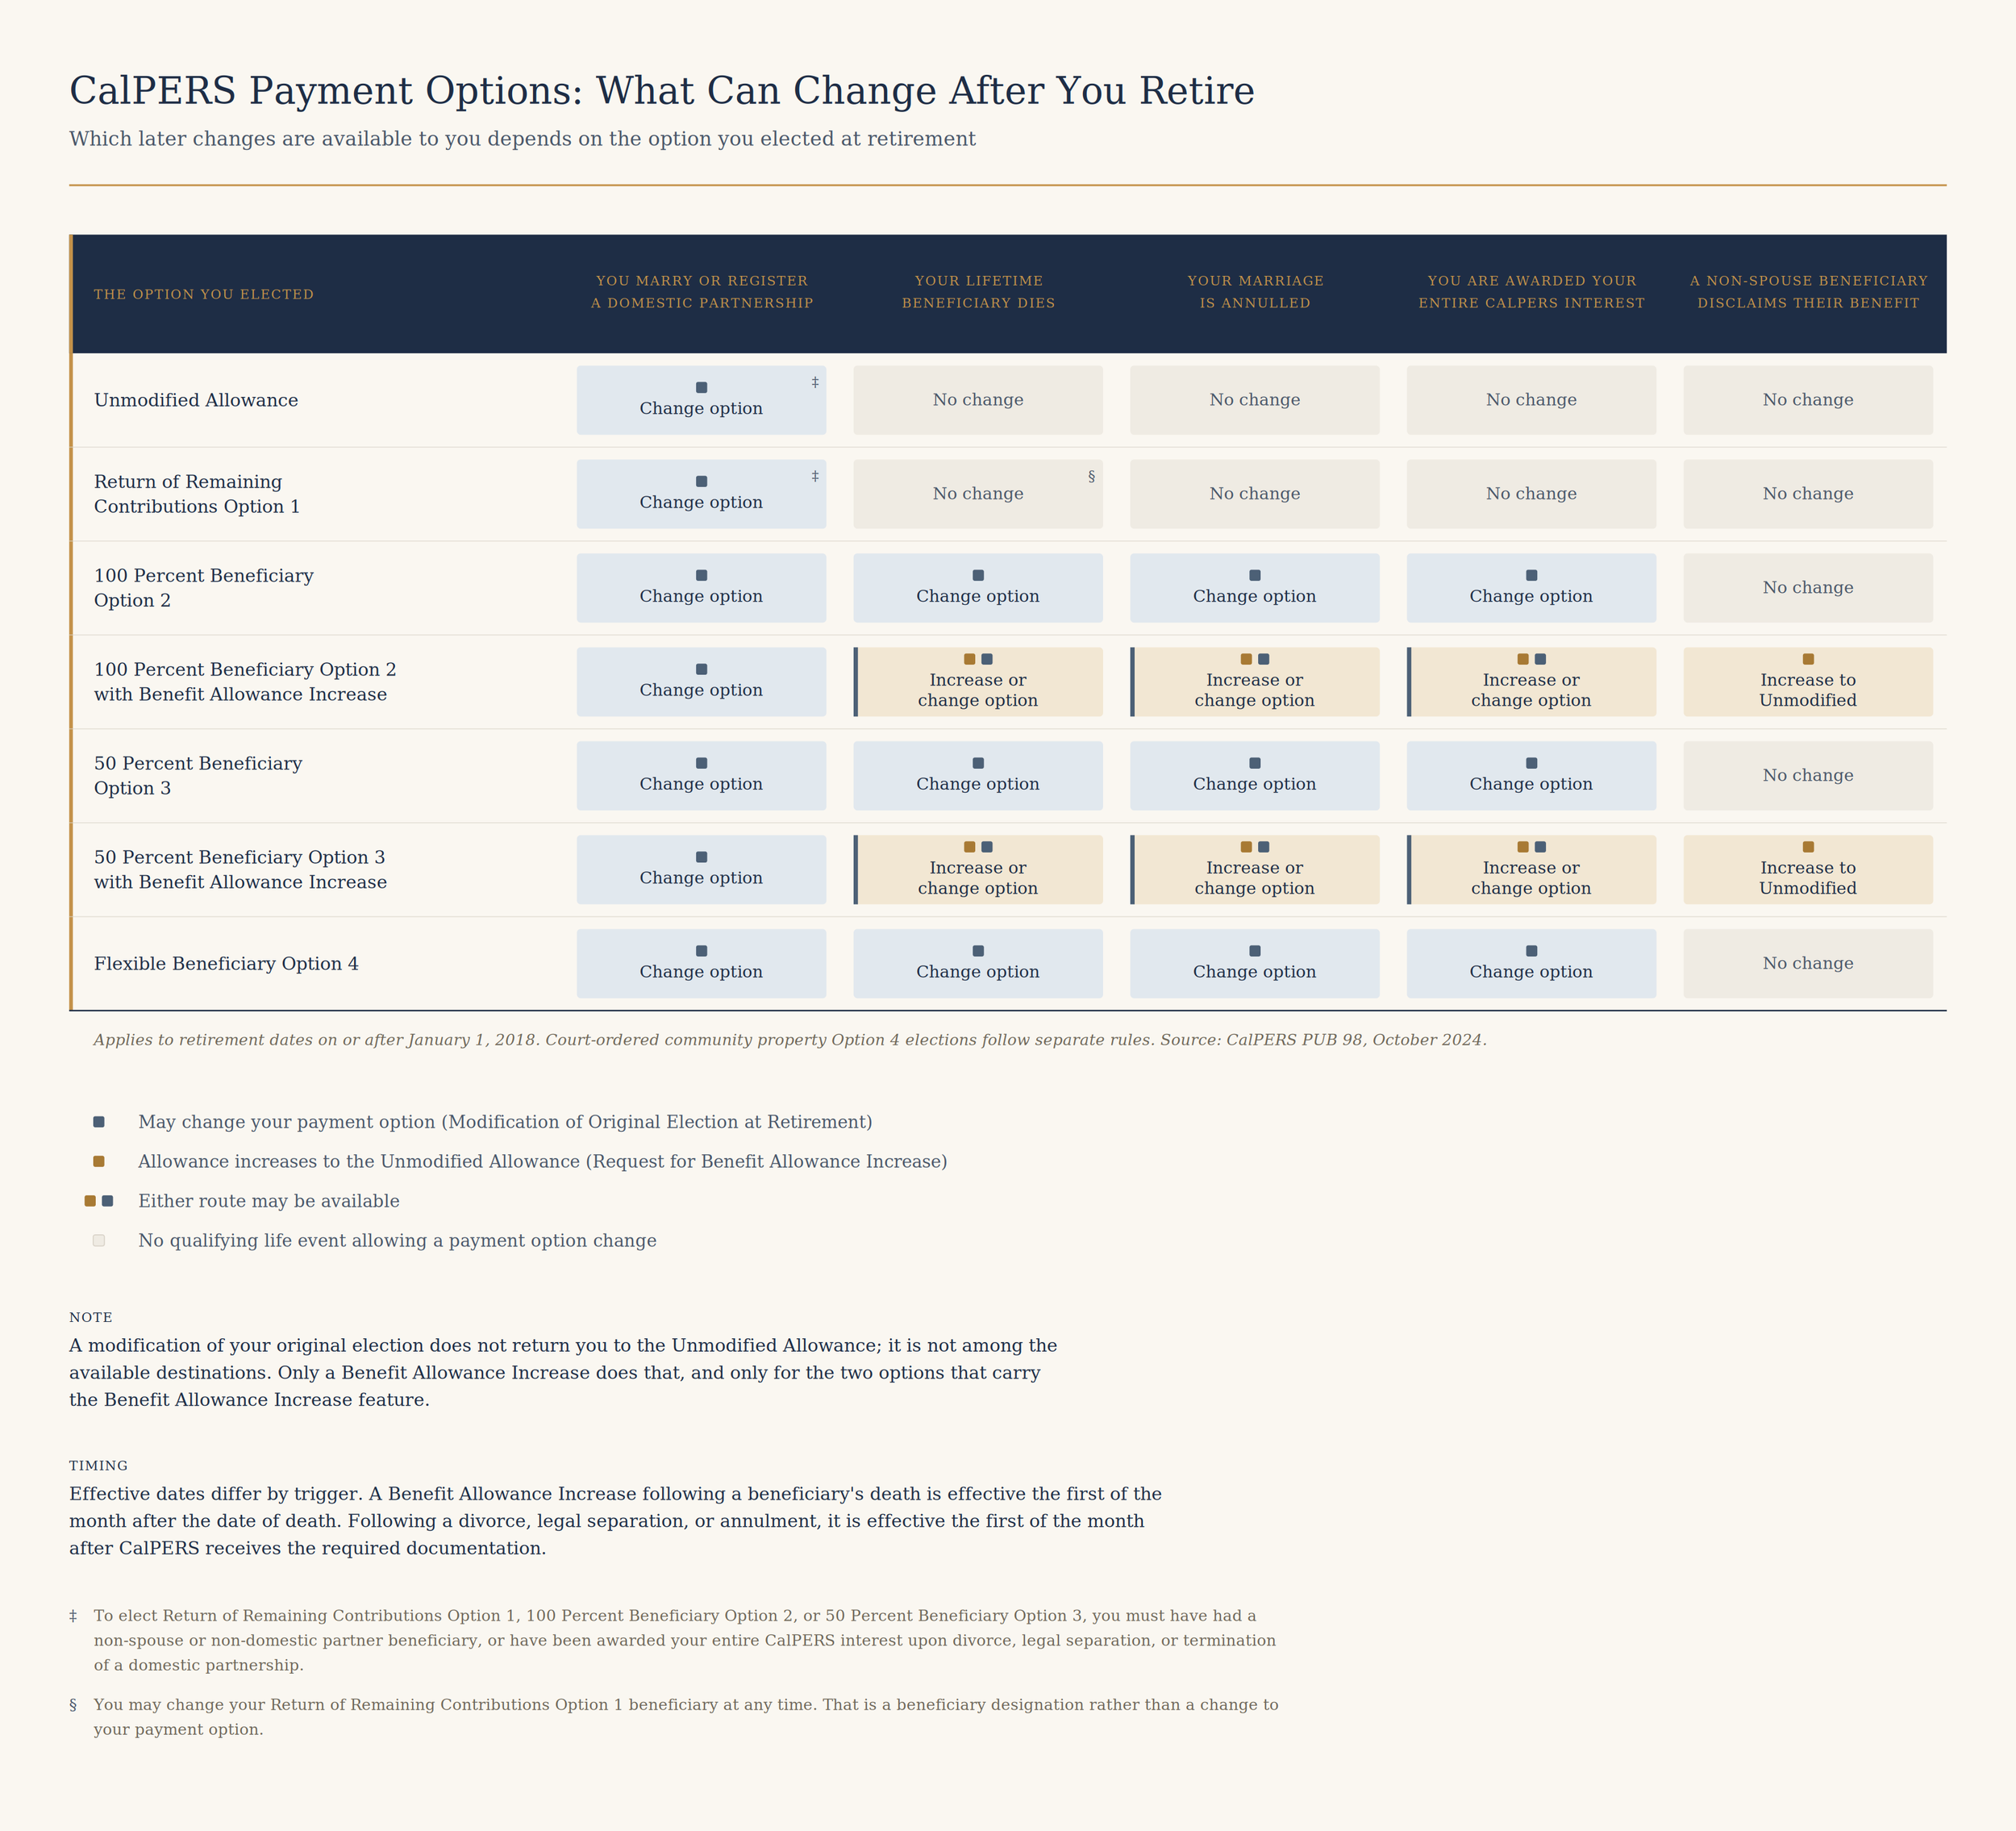
The election is durable, but it technically isn’t permanently sealed. There are limited ways to revisit it, and they depend on what you chose up front. There are really two separate mechanisms here, and they are important to keep straight.
The first mechanism is an automatic increase back to the Unmodified Allowance, available only if you elected one of the “with Benefit Allowance Increase” versions (or plain Option 2 or 3 before January 1, 2018). It triggers when your beneficiary dies, or on divorce, annulment, or a non-spouse beneficiary’s disclaimer, and you file a Request for Benefit Allowance Increase [7]. This is essentially the feature you paid for with a reduction, and effective dates run from the event or from when CalPERS receives your paperwork [7].
The second is a modification of your original election, to name a new lifetime beneficiary or move to a different option, triggered by marriage, a domestic partnership, your beneficiary’s death, annulment, or being awarded your entire CalPERS interest in a divorce [7]. Which of those helps you depends on what you hold. If you elected the Unmodified Allowance or Option 1, marriage or a new domestic partnership is the only event that lets you change your option [7]. If you elected any of the beneficiary options, all of the events are open to you, but with one asymmetry to know about before you file: a member who outlives their beneficiary can name someone new or switch options, but cannot return to the Unmodified Allowance. The permanent reduction stays; only its purpose changes [7].
Three details carry consequences. A modification reduces your allowance again to fund the new beneficiary, and your COLA and Purchasing Power Protection Allowance are recalculated on the new, lower base [7]. The timing rule is the one that catches people. Elect within 12 months of the event, and it takes effect the next month. Elect later than that, and the change is deferred a further 12 months, and both you and your new beneficiary have to be living on that deferred date, or it can’t process [7][8]. And two things that look like they should qualify do not: marrying someone you already named as beneficiary (they are already your beneficiary), and a non-spouse beneficiary disclaiming their benefit, which removes them but does not let you name a replacement [7].
The Spousal Signature Requirement
If you are married or have a registered domestic partner, your spouse or partner generally must sign your retirement application. The exception is narrow. Their signature is not required where the option you elected provides them 100 percent of your monthly allowance, meaning the 100 Percent Beneficiary Option 2 or that option with the Benefit Allowance Increase, and you also named them as sole beneficiary for any lump sum benefits [10].
The Size of the Reduction
CalPERS does not appear to publish a general option factor table in its member materials. The reduction is calculated individually, and the ways to see your own number are a myCalPERS estimate or a Benefit Estimate Letter. The factors themselves are actuarial equivalents built from Board-adopted assumptions, which are revised through an experience study roughly every four years [4].
The Effect of the Beneficiary’s Age
The age difference between you and your beneficiary is one of the larger variables in the reduction.
CalPERS states the relationship plainly in its member education material: the cost depends on the ages of both you and your beneficiary at the time of retirement, and the younger your beneficiary, the greater the reduction to your pension to fund their benefit [13]. The same applies to the Flexible Beneficiary Option 4, where the reduction while you are alive depends on your beneficiary’s age and on the dollar amount or percentage you select [13].
CalPERS does not appear to publish a table showing how much the gap moves the number. The practical workaround is that the myCalPERS Retirement Estimate Calculator accepts a beneficiary date of birth, so running the same estimate more than once with different dates shows the sensitivity in your own case. If you are weighing a continuance against life insurance, run that comparison first, since a large age gap tends to increase the reduction to your pension, which could make life insurance a cost-effective alternative.
For readers who want to see worked numbers, a 2015 CalPERS staff analysis published an illustrative reduction for each option using a single average-retiree profile (Retirement Options Simplification, Agenda Item 5, Attachment 1). Treat it as one dated example rather than a schedule: it predates the 2017 and 2021 experience studies, and it describes one age pairing rather than yours.
A Framework for Deciding
The options aren’t ranked, and I can’t tell you which one is best in the abstract, because it depends entirely on your household. What I can give you is the order I’d think through it in. Work these six questions in sequence, and each one narrows the field before you get to the next.
1. Does anyone actually depend on your pension income?
If no one relies on this income after you’re gone (no spouse, no partner, no dependent), then a reduced option means paying for a lifetime reduction to fund a benefit nobody needs. The Unmodified Allowance is probably the sensible default there, and any wish to leave something behind could be handled on your balance sheet rather than inside the pension. If someone does depend on it, keep going.
2. Is there a Survivor Continuance floor underneath the whole decision?
Some employers contract for Survivor Continuance, which pays an eligible survivor a portion of your allowance (often one half, or one quarter if you were covered by Social Security in your CalPERS service) regardless of which option you pick, including the Unmodified Allowance [5][6]. Where it applies, the Unmodified Allowance does not leave your spouse with zero; it leaves them with the floor. That reframes the entire question: an option is no longer buying your survivor’s whole income, only the gap between the floor and what they would actually need. Confirm in writing whether your employer contracts for it, because it is employer-specific, not a CalPERS default [5].
3. Does your spouse’s health coverage ride on this election?
This is the consequence that potentially dwarfs the monthly dollar consideration. Where retiree health runs through CalPERS, a surviving spouse generally keeps coverage only if they receive a continuing monthly check, either a Survivor Continuance or a benefit from the option you elected [7][9]. Elect the Unmodified Allowance with no continuance underneath it, and coverage can end, with COBRA as a time-limited fallback rather than lifetime retiree coverage [6]. The premium your survivor would pay to replace it can exceed the income the Unmodified Allowance gained you, which means a beneficiary option is sometimes buying health coverage that doesn’t show up anywhere in the income comparison. (SMUD retirees confirm this separately: SMUD runs its own retiree medical plans, so the rules live in SMUD’s documents, though the question is identical [12].)
4. How much does your age gap move the price, and how healthy are you both?
The reduction is individual and grows the younger your beneficiary is relative to you, because CalPERS expects to pay the continuance longer [13]. Run your own myCalPERS estimate more than once, changing the beneficiary date of birth, to see the sensitivity in your case. Then sit with the question the actuarial tables only answer on average: who is likely to outlive whom? The full-continuance options and their pop-up variants are effectively a bet on that answer. That’s fine, as long as you’re making the bet on purpose rather than by default.
5. Does your survivor need lifetime income, a lump sum, or neither?
A spouse with limited independent retirement income and a long life expectancy has a different problem than an adult child who would rather have a lump sum. The first points toward a continuance option sized to the income gap from question 2. The second points toward Option 1, a Flexible Option 4 amount, or leaving the pension unmodified and solving it elsewhere. The goal is to match the benefit to what the person actually needs.
6. Have you priced the alternative before you commit?
The pension continuance is one way to protect a survivor; a life insurance policy is another, and the two are best compared rather than assumed (it’s worth noting here, I am generally not a fan of permanent life insurance, and do not personally sell life insurance, but I do think this is one of the legitimate use cases for it so long as the pricing makes sense). Ask what permanent coverage (not term that may lapse before you die) costs at your current age, whether you are insurable, and, most importantly, whether it solves only the income question or also the health-coverage question from step 3, since a death benefit does not by itself continue a CalPERS health plan. A large age gap tends to raise the cost of the continuance, which is part of why it could make sense to price out a life insurance policy (it works a little like Option 1, except the residual benefit is locked in instead of declining over time).
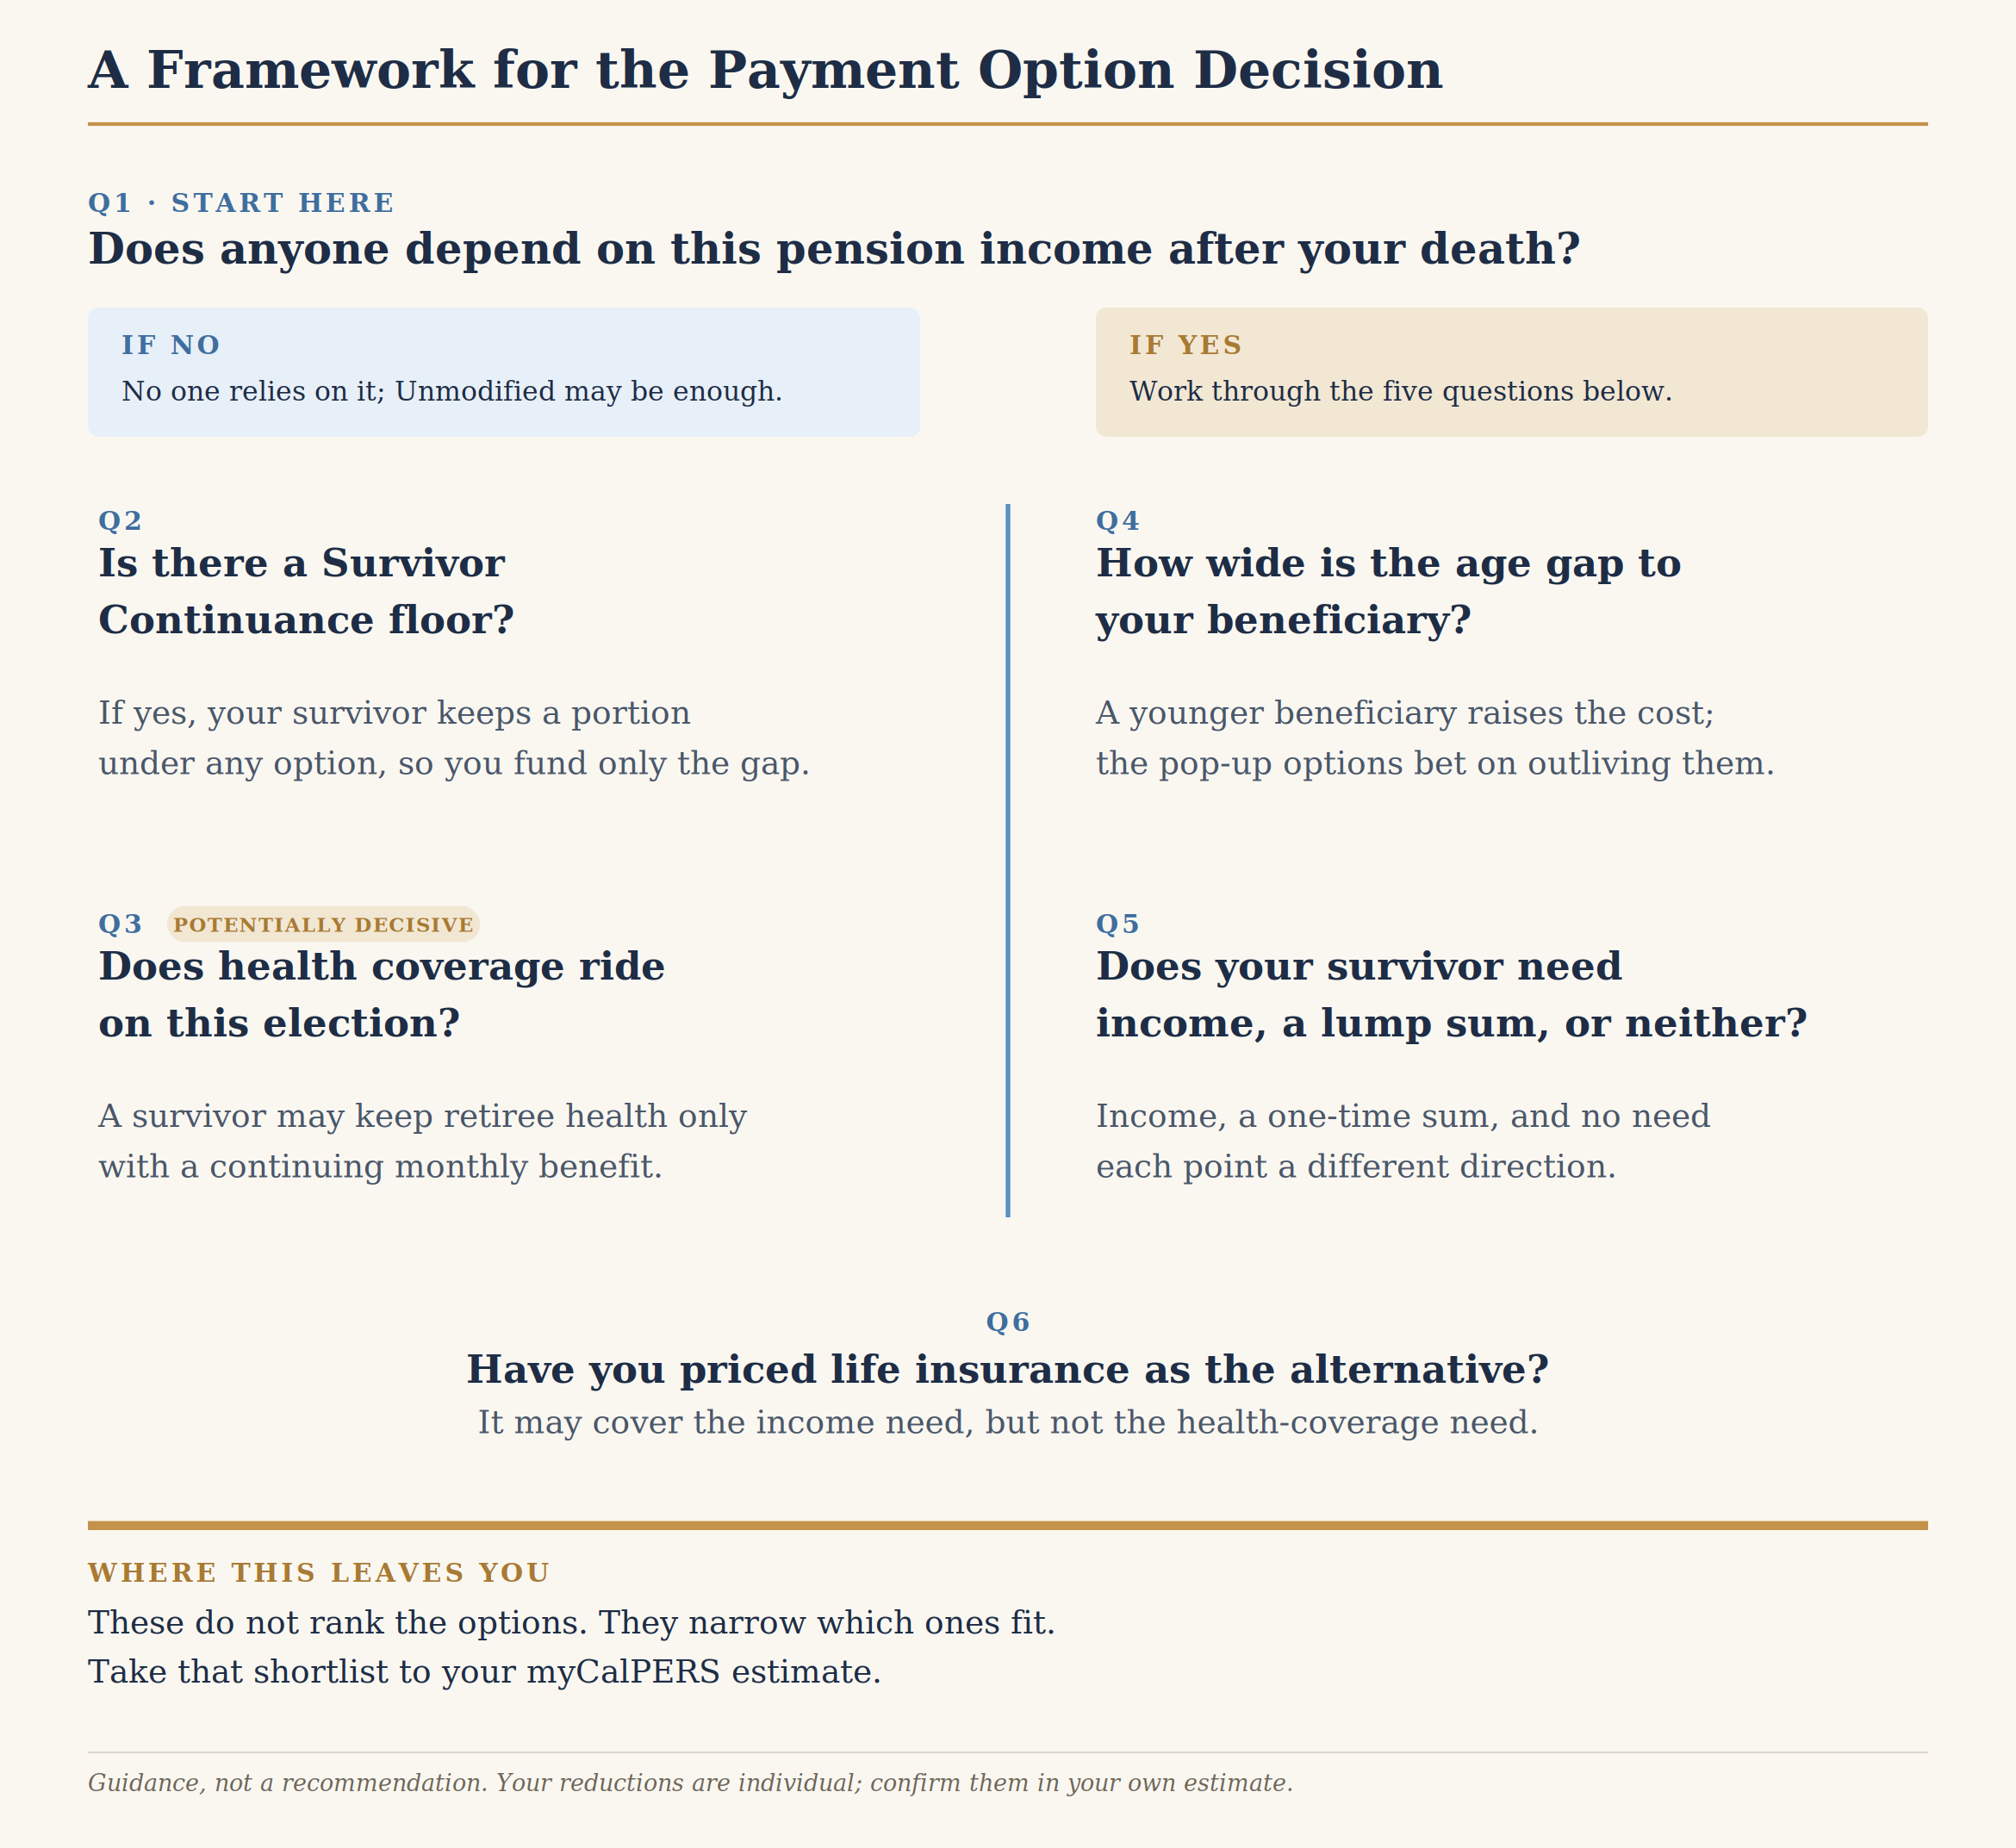
Work those six in order and hopefully you’ll usually be down to one or two options that fit your situation, instead of seven that all look plausible on paper. The estimate CalPERS gives you shows the reductions, but it can’t show you the household consequences, and in my experience the consequences are what the decision actually turns on. It’s also where working with someone tends to help, since the right answer shifts with your retirement date, your Savings Plus and 457 balances, how each spouse claims Social Security, and any coverage you’re already carrying.
If you want to work with someone who does this for CalPERS members
I'm a fee-only CFP® professional, and I work with CalPERS members across California on exactly these decisions: the timing, the tier interactions, and how the pension fits with everything saved beside it. If you'd like a second set of eyes on your own numbers, you can book a time below.
Sources
[1] CalPERS, “Curious About CalPERS Retirement Payment Options?” PERSpective, July 10, 2025.
[2] CalPERS Circular Letter 200-054-17, “2018 Retirement Options,” September 6, 2017, and the attached 2018 Retirement Options Quick Reference Sheet.
[3] Assembly Bill 2404 (Cooley), Retirement Option Simplification, 2016.
[4] CalPERS Pension & Health Benefits Committee, Agenda Item 4b, February 13, 2018 (Option 4 additional-forms staff recommendation); and Agenda Item 5, “Retirement Options Simplification,” October 20, 2015, Attachment 1 (illustrative per-option reduction amounts for one average-retiree profile), calpers.ca.gov/documents/201510-pension-item-5-attach-1/download. Actuarial assumptions underlying optional settlement factors are reviewed in the CalPERS Experience Study and Review of Actuarial Assumptions.
[5] CalPERS, Post-Retirement Survivor Benefits: Retired Member Death Benefits (PUB 60), and Post-Retirement Survivor Benefits: For Retired Members, Non-Spouse Claim (PUB 61).
[6] CalPERS, “Benefits Payable,” Death Benefits.
[7] CalPERS, What You Need to Know About Changing Your Beneficiary or Monthly Benefit After Retirement (PUB 98), October 2024, including the Retirement Option Reference Charts and the Request for Benefit Allowance Increase form.
[8] CalPERS, “Getting Hitched After Retirement? Update Your Life Option Beneficiary,” PERSpective.
[9] CalPERS, CalPERS Health Benefits Into Retirement, member education learning guide.
[10] California Government Code section 21261.
[11] SMUD, Employee Benefits, and SMUD Retiree website, Pension.
[12] SMUD, Retiree Benefit Guide.
[13] CalPERS, Your Retirement Estimate and Payment Options, member education learning guide, revised March 2023; and myCalPERS and Your Retirement Options, member education learning guide.
Disclosures
Fiduciary Financial Advisors does not accept any liability for the use of the information discussed. Consult with a qualified financial, legal, or tax professional prior to taking any action. Before investing, consider investment objectives, risks, fees, and expenses. Investments in securities involve the risk of loss, including loss of principal. Past performance is no guarantee of future returns. The views and opinions reflected in the content are subject to change at any time without notice. The content speaks only as of the date indicated. Some information was obtained from external sources. The information is believed to be accurate, but there is no guarantee that it is.
This content is for educational purposes only and does not constitute personalized tax, legal, or investment advice. Consult a qualified CFP®, CPA, or attorney before taking action.
Fiduciary Financial Advisors is a registered investment adviser. Nothing here constitutes individualized investment advice. Examples are illustrative only and not recommendations. No guarantee of future results. Third-party data is not independently verified.
CFP® and CERTIFIED FINANCIAL PLANNER® are certification marks owned by the CFP Board.

Understanding Your CalPERS Retirement Formula: Classic vs. PEPRA and What It Means for You
One number in your CalPERS pension was set before your first day, and it's permanent. Here's how to tell which formula you have, and why it shapes when you retire.
Your hire date already determined your formula. Here’s what it means for the decisions you can make.

The day you started your covered job dropped you into a retirement formula, and unlike other things in your plan, you cannot renegotiate it, buy your way out of it, or age back into a better one. A 2013 hire date and a 2012 hire date, one week apart, may mean a different pension for the same work. You can't change which formula you're in, so the whole game is reading it correctly and planning around it.

How your formula gets set
Your pension is based on a formula, not an investment balance. Three inputs, multiplied: your years of service (service credit), a benefit factor set by your age when you retire (benefit factor), and your final compensation (your highest average pay over a set window) [3]. Classic and PEPRA members have the same 3 components, but plug different numbers into them (more on that to follow).
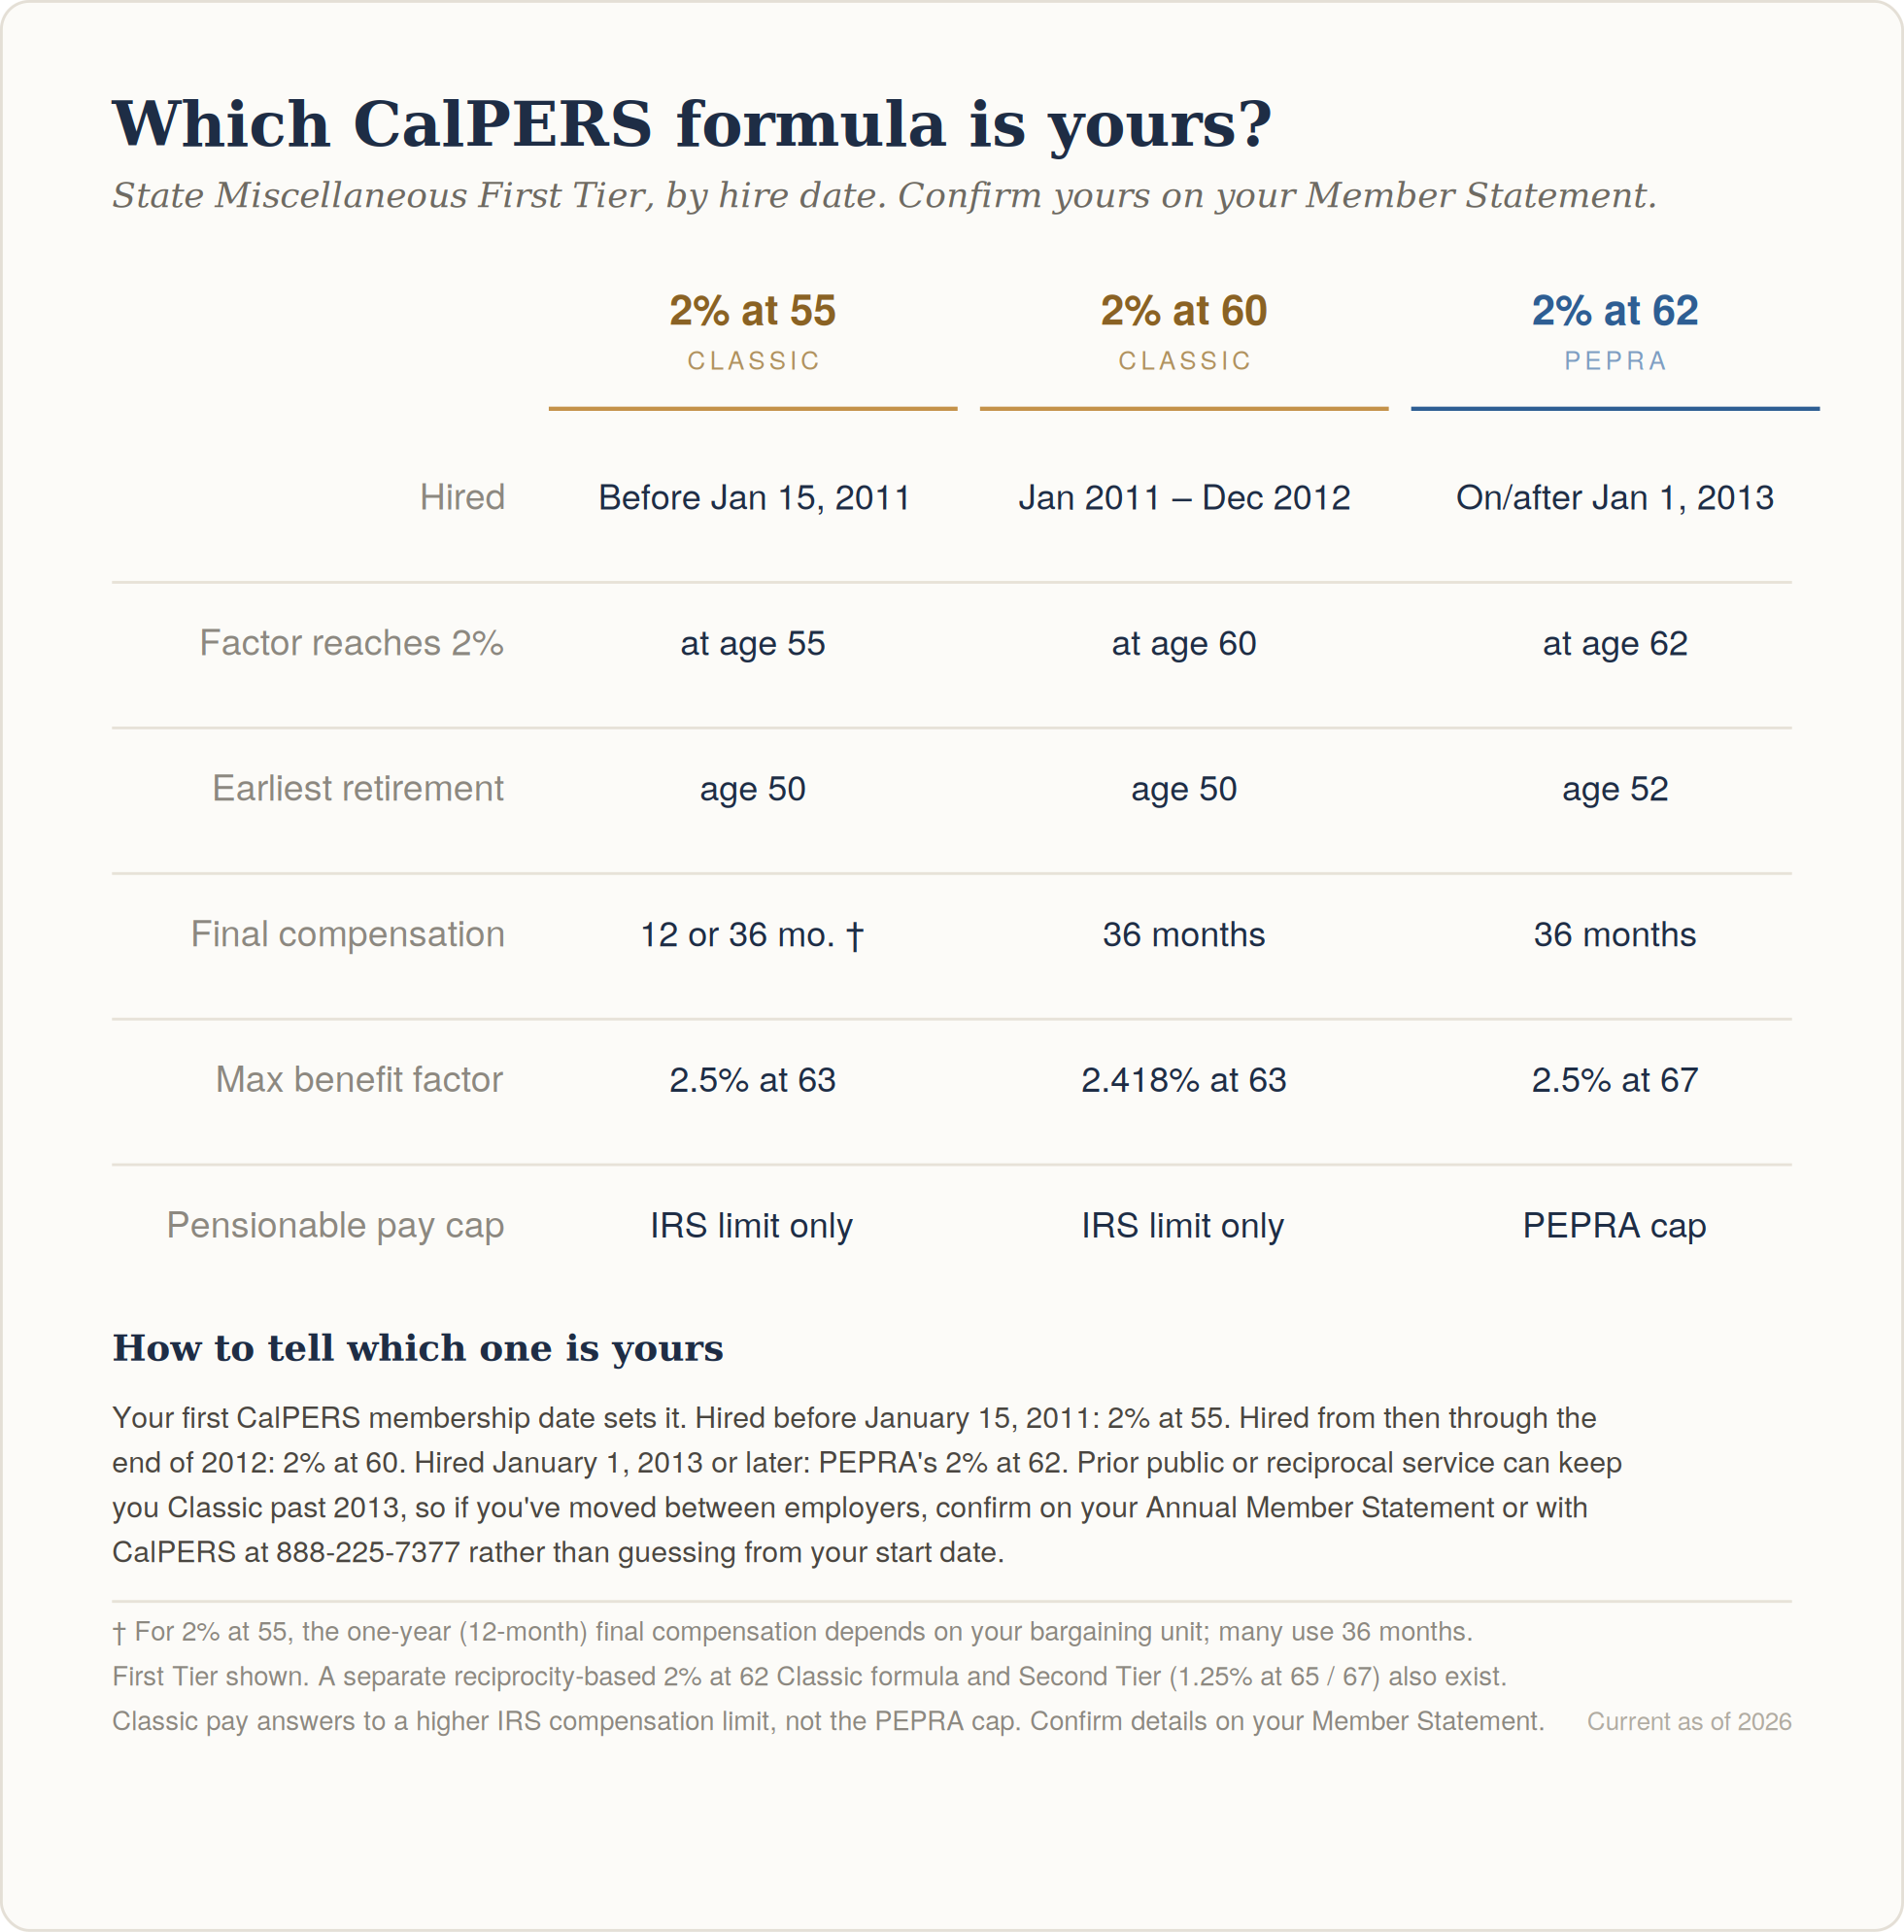
Which set of numbers you get comes down to your first membership date. State Miscellaneous splits mainly three ways. If you were first hired before January 15, 2011, you're generally on 2% at 55. From then through the end of 2012, it's (generally) 2% at 60, which at face value is the same factor but at a later age (but it does cap out at a lower factor of 2.418% instead of 2.5%). And 2013 or later puts you under PEPRA's 2% at 62 [2]. (Two more sit off to the side: a separate 2% at 62 Classic formula for certain reciprocity cases, not the same as PEPRA's despite the shared name, and the lower Second Tier formulas. If either applies to you, the numbers below shift.)
The “at” age is the tell. It's the age where your factor reaches 2% per year of service. Below it, your factor is prorated down; above it, it keeps climbing to a ceiling.
The answer to “which one am I?” is on your CalPERS Annual Member Statement, which names your formula outright. Reach for the rest only if you don't have it handy: your membership date sets the Classic/PEPRA line, your unit and hire era sort the two Classic formulas, and prior public or reciprocal service can keep you Classic past 2013. If you've moved between employers, it adds additional complexity, so confirm it rather than assume.
What your formula changes about the decisions you can still make
The formula itself is fixed. The three components it sits on are not, and it tilts each one a different way depending on your tier. The grid below puts the whole interaction in one view, and the diagonals are the part to slow down on. The chart shows how much of your final compensation your pension would replace based on the formula. The planning implication is that when you decide to leave, this can help you determine how much of a gap you may still need to make up with other investments and retirement income sources.
ONE-YEAR OR THREE-YEAR FINAL COMP? This isn't necessarily as straightforward as it may seem. There is a Classic-versus-PEPRA split, but also a difference depending on which bargaining unit applies to you. So even if you are a Classic member, it is possible that the Final Comp piece of your formula could be based on your highest 12, or your highest 36 consecutive months [3]. So this is important to keep in mind when you are evaluating when you retire, particularly if you happen to receive a significant pay bump.
It is also important to keep in mind that there is a pay cap that decides whether part of your paycheck is building a pension at all. The PEPRA formula caps the pay that counts toward your pension much earlier on than the Classic formula (which functionally is the IRS limit that is much less likely to even affect you [1]). If you're a PEPRA member earning above the cap, the dollars above it stop growing your pension, though your service credit keeps accruing in those years, and your Benefit factor continues to increase. (PEPRA members also generally pay at least half the normal cost of their benefits, and the employer cannot pick up the member's share [4].)
So, if you ask me, the big planning implication (which I already alluded to) in all of this is knowing how much of your future retirement income can be replaced by your pension, vs other sources. This means that utilizing Savings Plus becomes more important for members who are under the PEPRA formula, and particularly if you are over the income cap or have fewer years of service credits, since your pension benefit will likely not be replacing as much of what you need in retirement. (However, this is at the start of retirement, and you likely will want to have supplemental savings to help replace what is eroded by inflation over time either way).

Questions to Ask
● Which formula and tier apply to you, confirmed against your Annual Member Statement rather than your memory of your hire date?
● At what age does your benefit factor stop climbing, and where does your target retirement date sit relative to that?
● If you're Classic, do your planned exit and your highest 12 (or 36) months of pay actually line up?
● If you're PEPRA, what share of your target retirement income does the pension cover, and what's carrying the rest?
● Is any of your pay above the PEPRA cap, and if so, where is that income going?
If you want to work with someone who does this for CalPERS members
I'm a fee-only CFP® professional, and I work with CalPERS members across California on exactly these decisions: the timing, the tier interactions, and how the pension fits with everything saved beside it. If you'd like a second set of eyes on your own numbers, you can book a time below.
Sources
[1] CalPERS, “2026 Compensation Limits for Classic and PEPRA Members,” Circular Letter 200-001-26 (January 2, 2026).
[2] CalPERS, “Retirement Formulas and Benefit Factors.”
[3] CalPERS, “Your CalPERS Benefits: Planning Your Service Retirement” (Publication 1).
[4] California Government Code section 7522.30.
Disclosures
This article is provided by Fiduciary Financial Advisors, LLC and reflects general information that may not apply to your particular situation. Nothing in it should be relied upon as individualized advice. Please consult a qualified professional regarding your own circumstances before making decisions about your CalPERS benefits, retirement timing, or savings strategy.
The content above is for educational purposes only and is not intended as tax, legal, or investment advice. Illustrations use rounded figures to show general relationships and do not represent results any individual should expect.
Fiduciary Financial Advisors, LLC is a registered investment adviser. Registration does not imply a certain level of skill or training. Advisory services are offered only to clients or prospective clients where Fiduciary Financial Advisors, LLC and its representatives are properly licensed or exempt from licensure.
CFP® and CERTIFIED FINANCIAL PLANNER® are certification marks owned by the Certified Financial Planner Board of Standards, Inc. These marks are awarded to individuals who successfully complete the CFP Board's initial and ongoing certification requirements.

Choosing Your CalPERS Retirement Date
Your retirement date sets several CalPERS numbers at once: service credit, your benefit factor, your first COLA, and your leave-payout taxes. They rarely point to the same day. Here's how to time it.
Birthday Quarters, Fiscal Years, and COLA Timing

Your retirement date may feel more sentimental than financial, but for a CalPERS member, it also sets several (financial) numbers at once. Service credit, your benefit factor, when your first cost-of-living adjustment arrives, and how your final leave payout is taxed all move with the date you pick.
Most of this article is about windows, not deadlines. You don’t necessarily have to walk out on June 30 or December 31 to capture the benefits people tie to those dates (those exact dates may not even be exactly optimal for you). If you work for SMUD, Caltrans, a school district, or another CalPERS-covered employer, the pension mechanics apply the same way, since you retire through the same system. A few tax and payroll specifics are keyed to State of California payroll, so where those come up, confirm the equivalents with your own HR.
What the date controls
Your pension comes out of one formula, and it helps to keep its three pieces straight before we get into timing.
CalPERS runs on a fiscal year of July 1 through June 30, and service credit (the first piece of the formula above) accrues in tenths, not twelfths. For a full-time member paid monthly, about ten months of work inside that year earns a full year of credit.[1] If you start in July, the full year of service credit is likely earned by the next spring. So within the fiscal year, once you have banked a full year of service credit, staying on through June doesn’t add anything with respect to service credits.
Your benefit factor (the second piece of the formula above), steps up with each quarter-year of age, every three months, until it reaches the maximum for your formula.[1] So if you retire just after a birthday quarter, you lock in a higher factor than if you retire just before it. This matters while you are below that maximum benefit factor, and additionally, your formula and top age depend on your membership date and classification, so check the factor chart for your own formula.[1]
Your first COLA is where the exact day actually matters. It is tied to the second calendar year after the year you retire, and the adjustment is in the May 1 payment, not on a rolling clock from your retirement date.[1][2] That means retiring in late December rather than the first days of January makes a full year difference on when you receive your first COLA adjustment, even if the difference in your retirement date would just be days apart.[1]
Two ways to time it
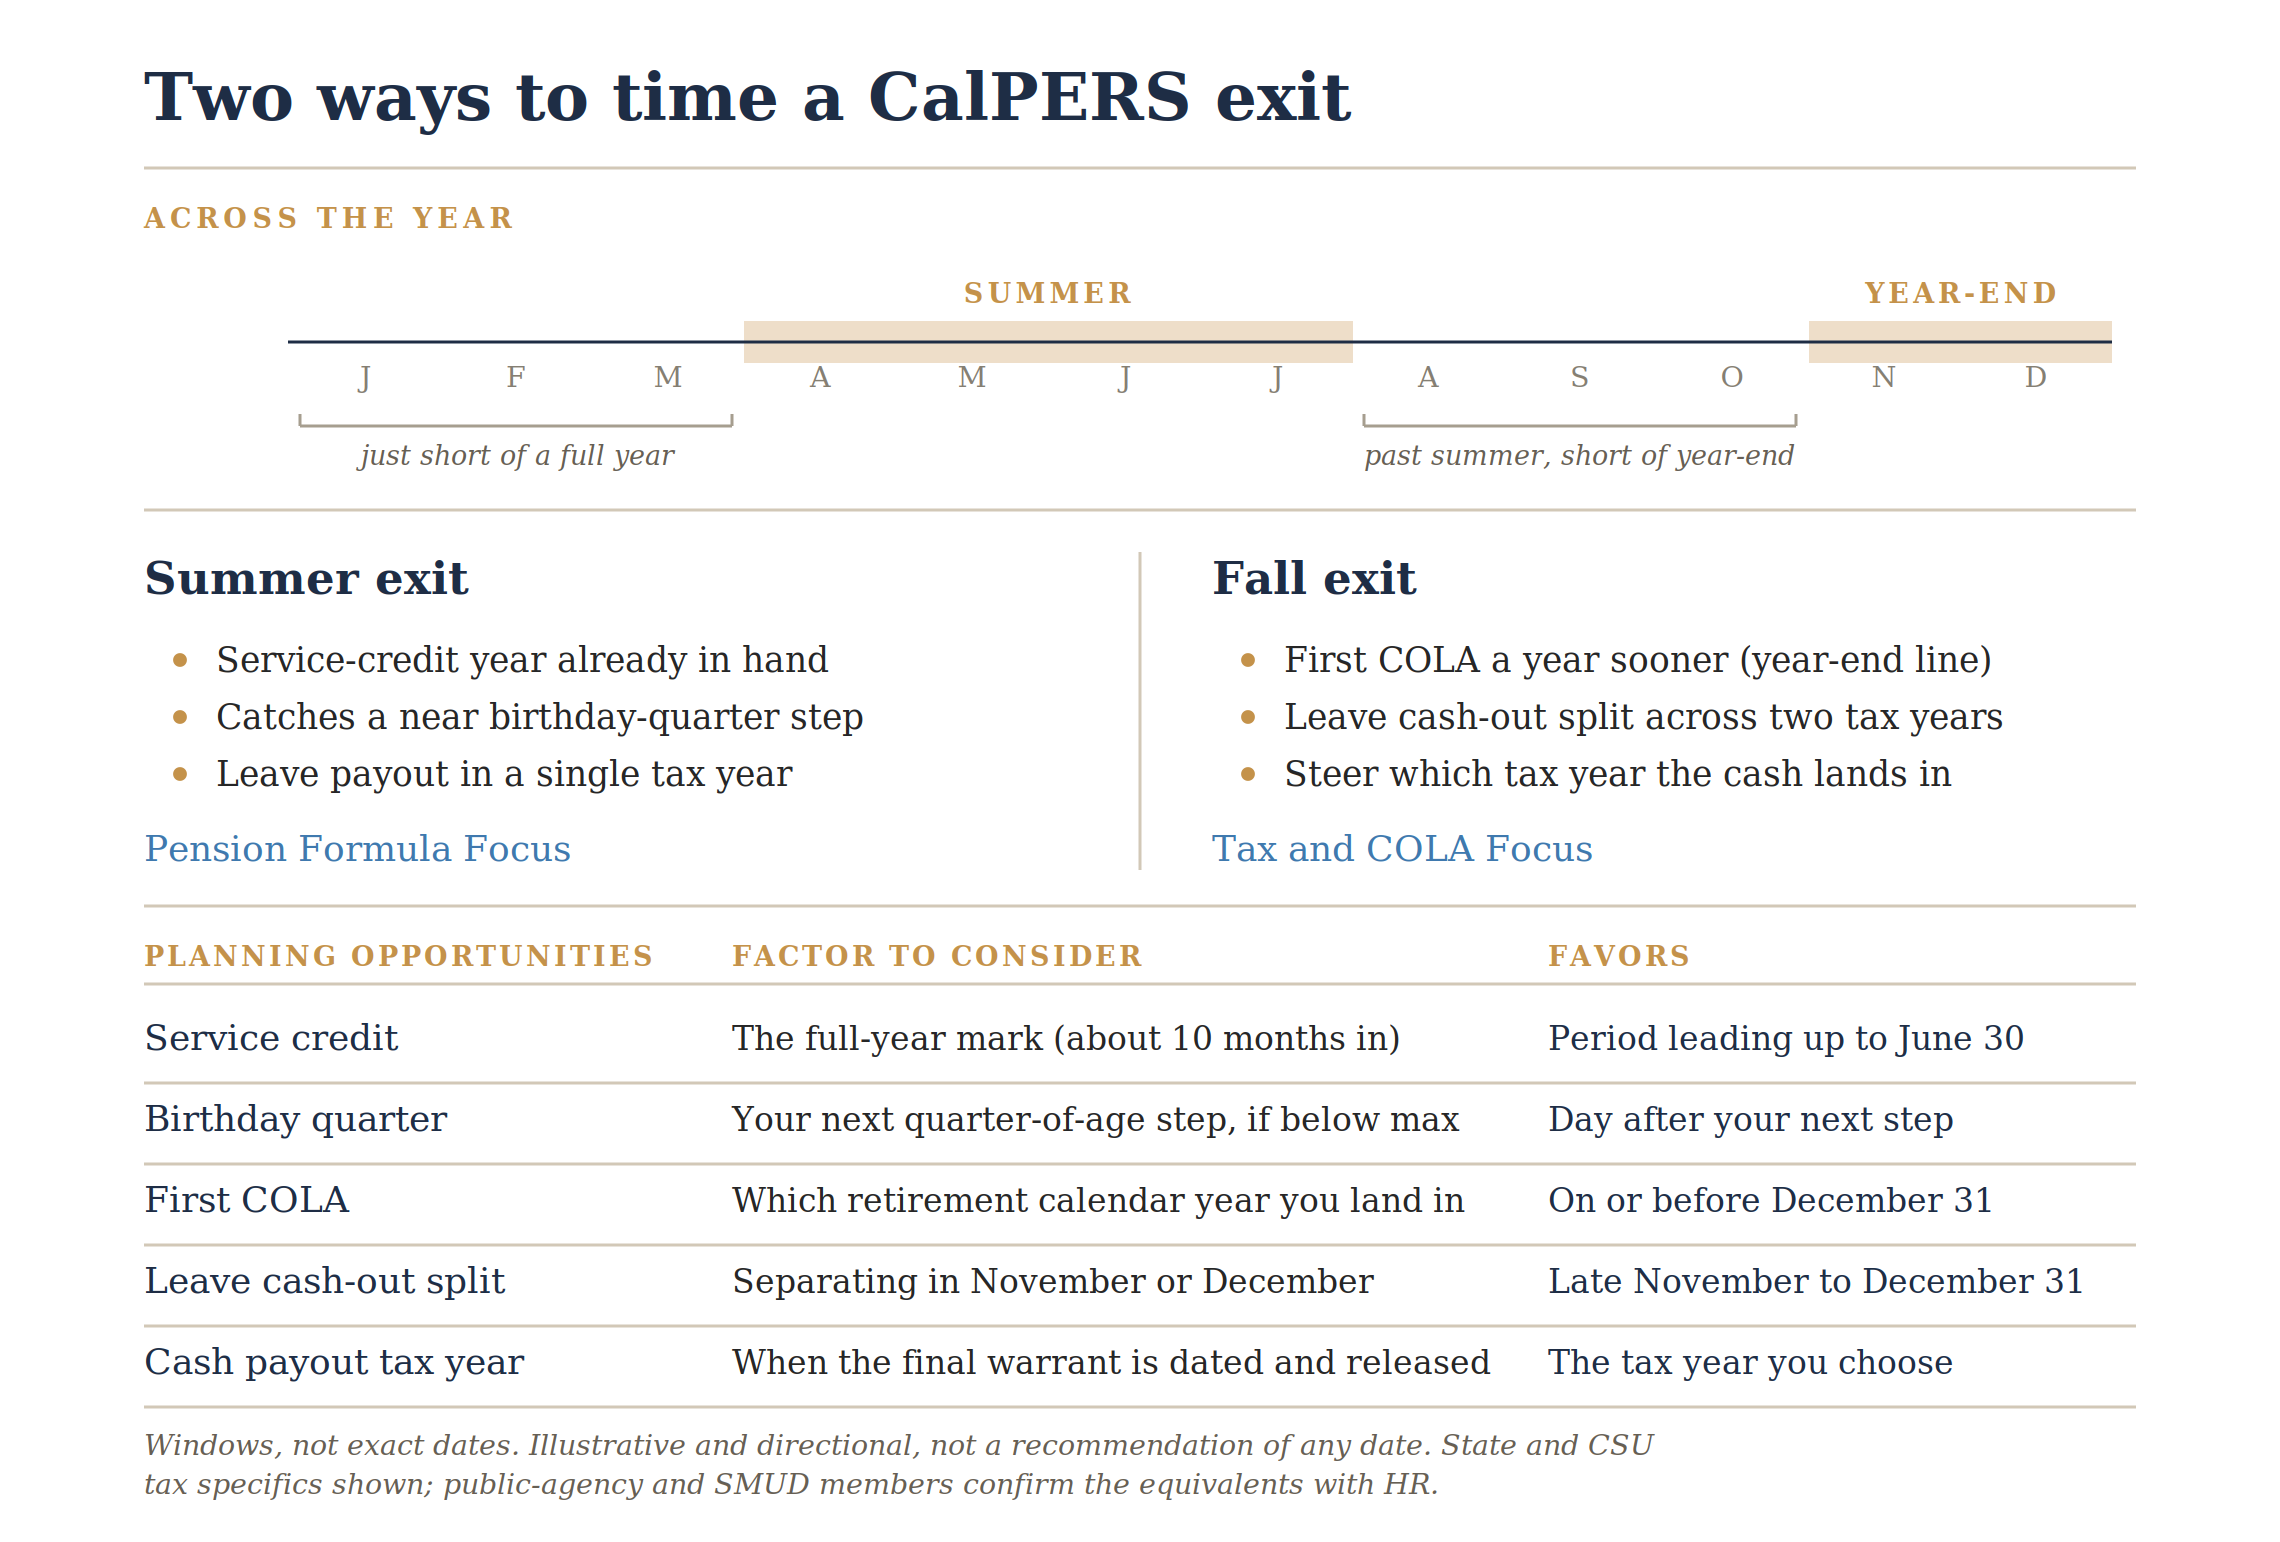
Line these up on a calendar and they cluster into two windows. One is a summer exit, sometime in late spring into summer, based around the pension formula itself. The other is a fall exit, from November into year-end, based around your COLA and the tax treatment of your leave payout. The stretches between them are (in my opinion) the weak spots. This is because if you leave in the earliest part of the year, you end up just short of earning another service credit, and if you leave late in the year, but before November, you lose out on being able to take advantage of the potential year-end benefits. In practice, the decision usually comes down to which part of the year makes more sense for you to retire in, then fine-tuning the exact day.
A summer exit focuses on service credit. Because the full year is banked about ten months into the fiscal year, you can leave in spring without giving up credit, and you don’t necessarily have to retire on exactly June 30 to get there. If your next birthday-quarter step also falls in this stretch, you may want to work long enough into summer to capitalize on it. The leave payout lands in a single tax year, which keeps that part simple. It suits members who have already banked the service-credit year and have more to gain from the pension math than from tax timing.
If you wait until the fall you will want to keep your COLA and your leave taxes in mind. By retiring before December 31, you’d get your first COLA a full year sooner than waiting until retiring after crossing into the new year. Then a late-year separation also opens a leave-payout option a summer date does not. State and CSU employees can direct a lump-sum leave payout into their Savings Plus 457(b) and 401(k) rather than take it all as cash, up to the annual limits (and those two plans carry separate limits).[3][5] For 2026 that is $24,500 of elective deferral per plan, plus an $8,000 catch-up once you are 50 (or $11,250 for the year you are 60 to 63).[4] Then so long as you separate near the end of the year, roughly from November on, the deferral can be split across two calendar years, each with its own limits, spreading a large payout over two tax returns instead of stacking it on one (there is also another catch-up unique to the 457(b) that I will get into another time).[3]
Two cautions come with that route. The election is irrevocable once you sign it, because the tax rules treat the money as yours the moment you could have taken it, so the choice has to be made before you separate, and the form has to reach your personnel office at least five working days ahead, in practice, you should probably plan on closer to a month.[3][6] And for whatever you take as cash, the tax year is set by when the payment is issued, not by your last day, so near year-end a few days of processing can carry the cash from one tax year into the next.[7] So if you choose to retire later in the year, you should make sure to give enough lead time to get your paperwork processed on time.
Matching the exit to the facts
To make this a little less abstract, let’s talk about a potential scenario. Let’s say there is a member who is 61, already at the top of their benefit factor, sitting on a large vacation balance, with a birthday quarter that passed back in the spring. At this point, the pension formula would be mostly settled for them, with the benefit factor around the max and the service-credit year now banked. What is still open is the determination of when they will receive their first COLA and what happens with the leave payout. By waiting until later in the year, they would potentially benefit from the increase in flexibility on how they handle the leave payout.
The flip side would likely be someone still climbing toward their factor maximum or with little leave saved, and may get more out of the summer window, or rather, give up less by going earlier in the year.
Neither window is a one-size-fits-all choice, so rank what applies to you and think about which season makes more sense, then settle on the exact day. Sorting out how a maxed factor, a leave balance, and a two-year tax split add up for your own situation is where personalized analysis may help before you file paperwork that you cannot easily undo.
The bigger question:
All of this optimizes the exit, but none of it answers whether you can afford to leave in the first place. Before you spend much energy on the perfect date, you may consider running the numbers on whether your pension, savings, and expenses support retiring at all. A well-timed exit does not help much if you are not ready to make it.
Disclosures
Fiduciary Financial Advisors does not accept any liability for the use of the information discussed. Consult with a qualified financial, legal, or tax professional prior to taking any action. Before investing, consider investment objectives, risks, fees, and expenses. Investments in securities involve the risk of loss, including loss of principal. Past performance is no guarantee of future returns. The views and opinions reflected in the content are subject to change at any time without notice. The content speaks only as of the date indicated. Some information was obtained from external sources. The information is believed to be accurate, but there is no guarantee that it is.
This content is for educational purposes only and does not constitute personalized tax, legal, or investment advice. Consult a qualified CFP®, CPA, or attorney before taking action.
Fiduciary Financial Advisors is a registered investment adviser. Nothing here constitutes individualized investment advice. Examples are illustrative only and not recommendations. No guarantee of future results. Third-party data is not independently verified.
CFP® and CERTIFIED FINANCIAL PLANNER® are certification marks owned by the CFP Board.
Sources
[1] CalPERS PERSpective, “Timing Your Retirement: Fiscal Years and Birthday Quarters Matter,” April 14, 2026.
[2] CalPERS, “Cost-of-Living Adjustment (COLA),” Retirees / Cost of Living.
[3] California Department of Human Resources (CalHR), Human Resources Manual § 1802, Transfer Leave Credits and Catch-Up (Savings Plus lump-sum separation pay deferral; two-tax-year election for late-year separations; irrevocable under Treas. Reg. § 1.451-2(a)).
[4] Internal Revenue Service, “401(k) limit increases to $24,500 for 2026,” Notice 2025-67.
[5] CalHR, Human Resources Manual § 1801, Contribution Rates (IRS annual limits apply separately to each plan, 401(k) and 457(b)).
[6] Savings Plus, “Lump Sum Separation Pay” (savingsplusnow.com); five-working-day filing requirement per California Labor Code §§ 201 and 202.
[7] California State Controller’s Office, Personnel and Payroll Services Division, year-end lump-sum separation processing guidance and payroll letters (processing cutoffs; warrant issuance timing).

Perks and Lesser-Known Benefits California State Employees Are Talking About Online
A lighter roundup for state employees curious about the small stuff beyond the pension and health plan. Here are the perks and discounts that kept coming up on r/CAStateWorkers, from travel and subscription deals to on-site amenities, plus how to confirm what actually applies to your department and bargaining unit.
A lighter roundup for state employees curious about the small stuff beyond the pension and health plan

Most of what I write focuses on the bigger financial decisions that tend to keep people up at night. This one is a little different. I read through the CA State Workers Reddit page, and pulled together a list of the perks and discounts that kept coming up. None of this is official guidance, and availability appears to vary by department, bargaining unit, and even which building you work in. Think of it as a starting point for questions to ask your own HR office or union rep, not a promise of what you'll get.
Travel and Everyday Discounts
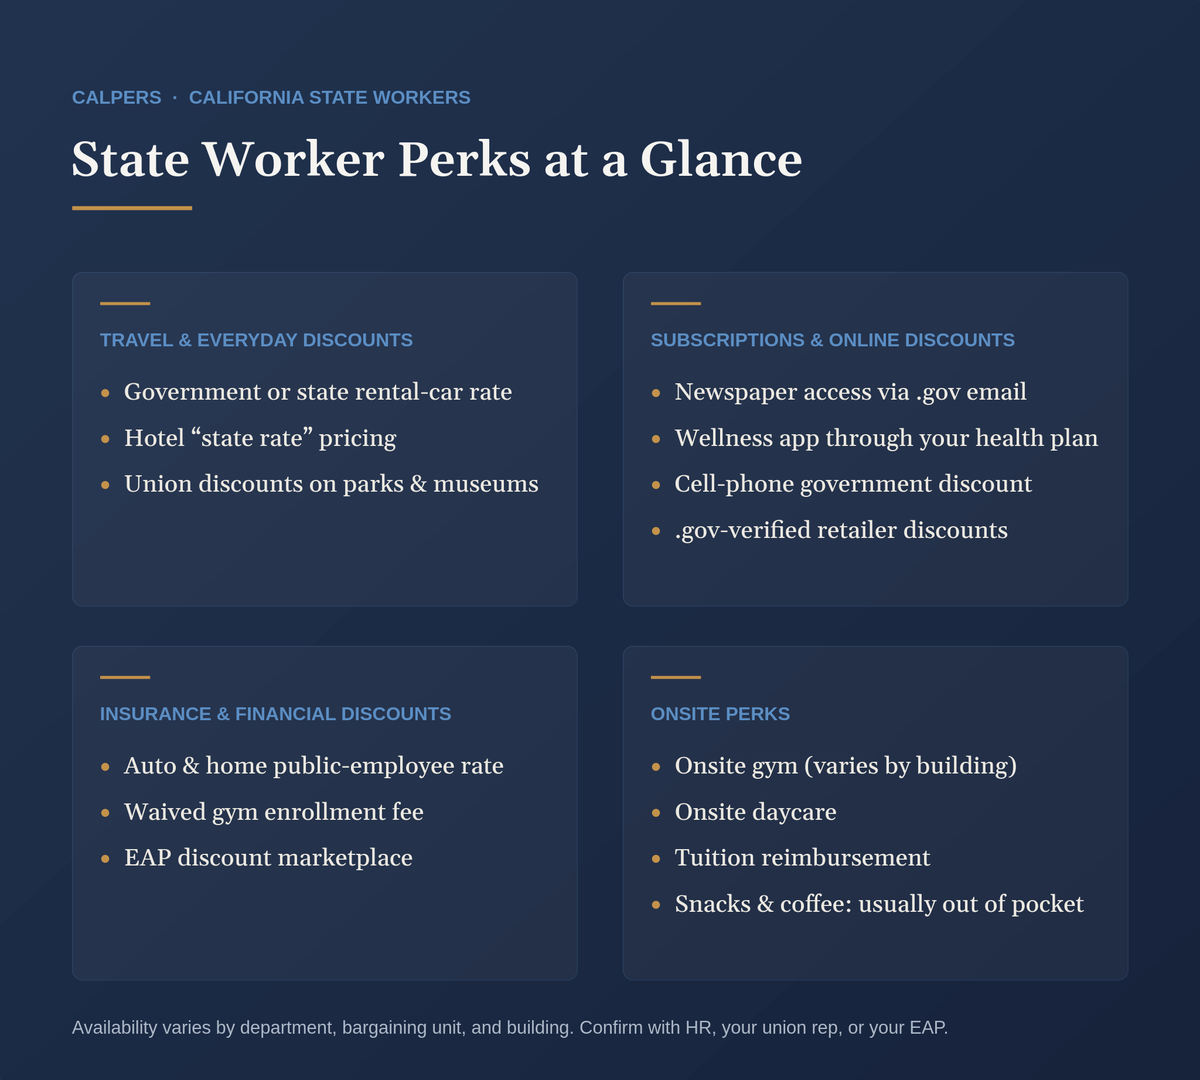
A few state employees mentioned saving money on travel by using employee rates that many companies don't advertise widely.
● Some rental car companies offer a government or state employee rate that can be selected at booking, with ID shown at pickup. One commenter mentioned saving a few hundred dollars on an upcoming rental this way.
● Hotel “state rate” pricing sometimes shows up as an option on a hotel's own booking site, though whether it applies to personal (non-work) travel seems to depend on the hotel and how your agency books travel.
● Union membership may come with discounts of its own on top of any statewide perks, including reduced-price tickets to state parks, museums, and other attractions.
Subscriptions and Online Discounts
Some perks are tied less to being a state employee and more to having a .gov email address or a particular health plan.
● Several employees mentioned getting a no-cost digital subscription to a major national newspaper using a .gov email address.
● Some health plans include a premium subscription to a meditation or wellness app as part of enrollment, at no added cost.
● Cell phone carriers frequently offer a discount for government employees, even on a personal line not tied to work.
● Some retailers and outdoor/sports brands offer a government or .gov-verified discount online, which may apply to something you already planned to buy.
Insurance and Financial Discounts
These came up often enough that a quick check with your current providers may make sense, even if the discount ends up being modest.
● Some insurance carriers offer a reduced rate on auto or homeowners policies for public employees. Ask your current provider whether this applies to you, since it often isn't advertised.
● Gym chains sometimes waive the enrollment or initiation fee for state employees, even when they don't offer an ongoing discount on monthly dues.
● Your Employee Assistance Program (EAP) may include access to a broader discount marketplace covering retail, entertainment, and travel, in addition to the counseling services EAP is best known for.
Onsite Perks (Your Building May Vary)
This is where things get the most department-specific, and a few commenters were quick to point out that many of these amenities carry a cost even when they look like a perk on paper.
● Some buildings have an onsite gym, though quality and equipment varied depending on the department and building.
● A few state buildings offer onsite daycare, though cost was mentioned as a limiting factor for many families rather than something heavily subsidized.
● Water bottle filling stations, small honor-system snack setups, and even a shared herb garden came up as examples of building-level culture rather than anything centrally provided or guaranteed.
● Tuition reimbursement programs exist at some departments, typically covering a portion of costs up to an annual cap, though this tends to be a department-level policy rather than a statewide benefit.
NOTE A few commenters clarified that snacks, coffee, and office celebrations are almost always paid for out of pocket by a manager or coworkers, not the state. If your building has a parking lot that's technically state-run, it may still come with a modest monthly fee.
A Few Things to Check Yourself
If any of these sound useful, the fastest way to confirm details is usually a quick check with your HR office, your union representative, or your Employee Assistance Program provider, since much of this depends on your specific bargaining unit and department rather than a single statewide policy.
None of this replaces the bigger financial picture: your pension, your health benefits, and how much you're setting aside in Savings Plus tend to matter more over the long run than a waived gym fee or a newspaper subscription. But a small discount here and there is a nice bonus while you're working out the larger plan.
This list was compiled by reading through publicly available discussion threads on r/CAStateWorkers, an unofficial online community for California state employees. It reflects informal, crowdsourced information shared by individual commenters rather than official state or CalPERS guidance, and availability and eligibility for any of the above may have changed or may not apply to your specific department, bargaining unit, or employment status.
Disclosures
Fiduciary Financial Advisors does not accept any liability for the use of the information discussed. Consult with a qualified financial, legal, or tax professional prior to taking any action. Before investing, consider investment objectives, risks, fees, and expenses. Investments in securities involve the risk of loss, including loss of principal. Past performance is no guarantee of future returns. The views and opinions reflected in the content are subject to change at any time without notice. The content speaks only as of the date indicated. Some information was obtained from external sources. The information is believed to be accurate, but there is no guarantee that it is.
This content is for educational purposes only and does not constitute personalized tax, legal, or investment advice. Consult a qualified CFP®, CPA, or attorney before taking action.
Fiduciary Financial Advisors is a registered investment adviser. Nothing here constitutes individualized investment advice. Examples are illustrative only and not recommendations. No guarantee of future results. Third-party data is not independently verified.
CFP® and CERTIFIED FINANCIAL PLANNER® are certification marks owned by the CFP Board.

Savings Plus, the CalPERS 457, and Your 401(k): Making Sense of Supplemental Retirement Savings as a California State Employee
If your CalPERS pension won't fully fund the retirement you're picturing, Savings Plus (or the CalPERS 457 Plan) gives you two ways to save more: a 401(k) and a 457(b). Here's why funding the 457(b) first tends to make sense for most participants who aren't maxing out both, and the cases where it doesn't.

A CalPERS pension may not fully fund the lifestyle you're picturing in retirement, and closing that gap may mean saving and investing more beyond the pension itself. If you work for the state or CSU (California State University), you have access to Savings Plus, which offers not one but two options, a 401(k) and a 457(b), and it's not always clear which one should carry the bulk of that supplemental saving. If you work for a public agency or school district, it may be the CalPERS 457 Plan instead, but only if your employer has chosen to contract with CalPERS for it (SMUD employees: check with HR, since SMUD is a local agency rather than a state department, and the specific plans on offer vary by employer).
Whichever combination applies to you, the practical takeaway tends to be similar: for most participants who aren't maxing out both plans, funding the 457(b) before the 401(k) may make more sense. Though the reasoning may not be obvious, so here's what's actually driving that (in my opinion).
The Two Plans, Briefly
Savings Plus (a 401(k) and 457(b), run by the California Department of Human Resources and Nationwide, not CalPERS) is available to State of California and CSU employees. [1] The CalPERS 457 Plan is a separate 457(b) that CalPERS offers directly to public agencies and school districts that choose to contract for it. [2] Either way, using both a 401(k) and a 457(b) draws on two separate IRS limits, not one: the elective deferral cap (the amount you can contribute from your paycheck) for 2026 is $24,500 per plan (assuming no catch-up), so using both effectively doubles your contribution room to $49,000. [3]
The Loan Ceiling Doesn't Double
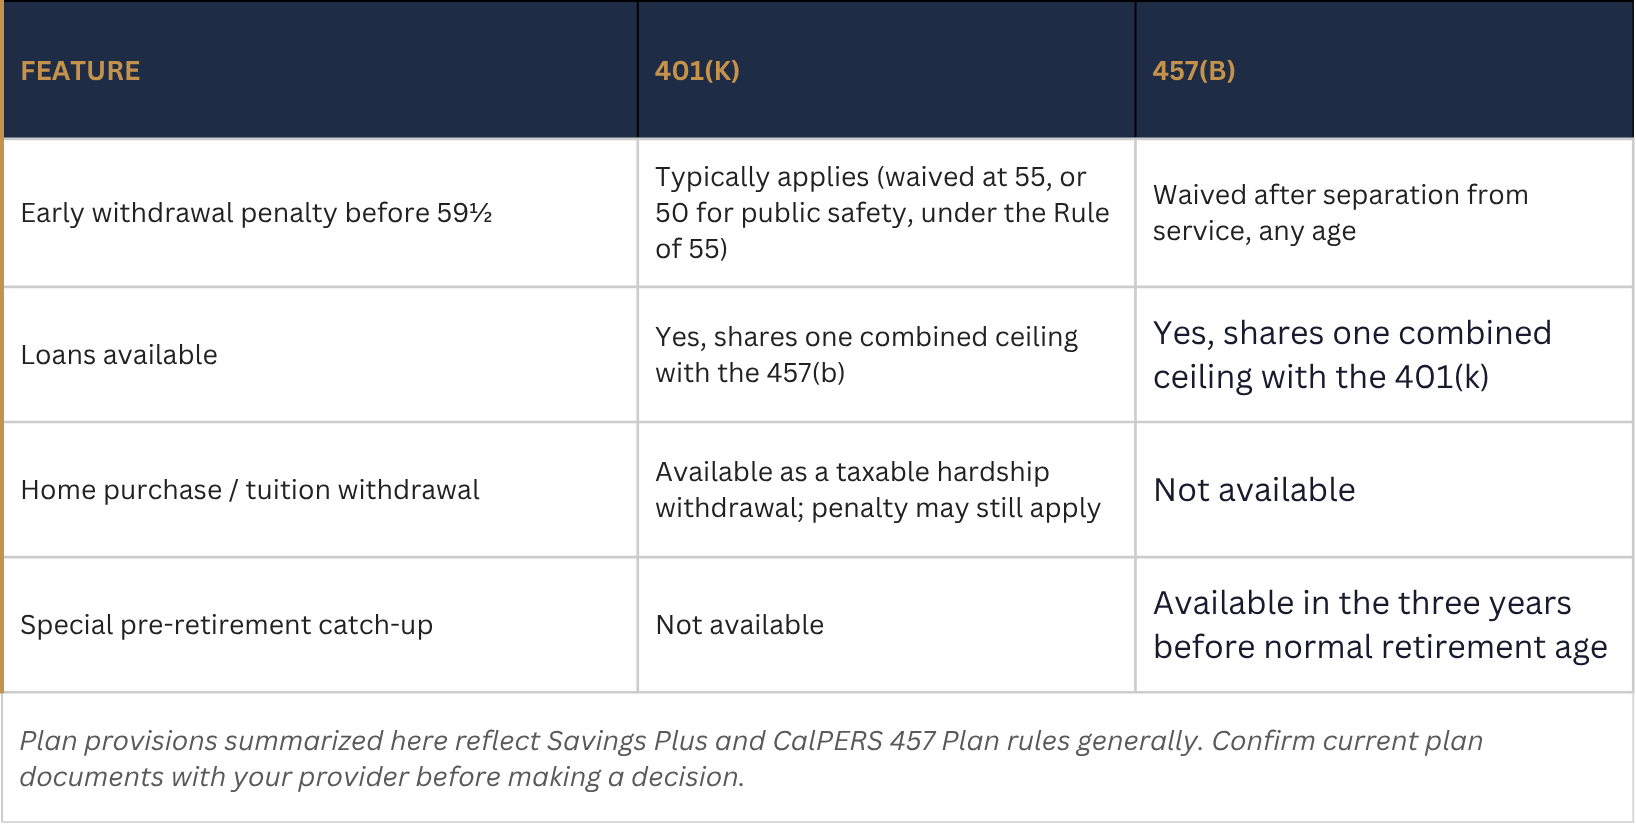
Both plans generally offer a loan, but having two accounts doesn't actually double what you can potentially borrow. Federal tax rules treat every plan the same employer maintains as a single plan for this purpose, so there's one combined ceiling, the lesser of $50,000 or 50% of your vested balance (the portion of the account that's fully yours), calculated across the 401(k) and the 457(b) together rather than separately for each. [4][5][6] Reaching the full $50,000 requires $100,000 in vested balance total, whether that's concentrated in one plan or split across both. That removes the main reason to overfund the 401(k) specifically, since the 457(b) counts toward the same shared loan ceiling.
The Hardship Withdrawal's Cost
The 401(k)'s one remaining distinguishing feature is the hardship withdrawal: an in-service withdrawal (meaning you can take the money out while still working) for a first-time home purchase or college tuition. The 457(b) doesn't offer either option. [4] But qualifying for the hardship and avoiding the 10% early withdrawal penalty are separate tests: meeting the hardship criteria doesn't by itself exempt you from the penalty if you're under 59½. [7] The withdrawal is permanent, with no repayment option. If any portion comes from a designated Roth account, the tax treatment depends on whether the distribution satisfies the applicable Roth distribution requirements under IRS rules. [8] That mix of cost, taxability, and permanence makes it a last resort, not something to plan a 401(k) balance around.
The Rule of 55: A Narrowing Nuance
The 401(k) also has a potential path to penalty-free access before age 59½, known as the Rule of 55. If you separate from service during or after the calendar year you turn 55, withdrawals from your current employer's 401(k) may be exempt from the 10% early withdrawal penalty, although pretax distributions generally remain subject to ordinary income tax. Eligibility depends on your individual circumstances and applicable IRS rules. [9] For qualified public safety employees under a governmental plan, police, firefighters, and similar roles, that age drops to 50. [9] This narrows the 457(b)'s advantage for anyone separating at or after that age; the edge is largest for someone leaving earlier, whether by choice or otherwise. The exception applies only to the plan of the employer you just left, so rolling that 401(k) into an IRA before 59½ gives it up (though there is another way to get funds out of an IRA before 59½ called the 72(t) or SEPP, but it comes with its own nuances). [9]
What's easy to miss: if you leave that job before the year you turn 55, the Rule of 55 doesn't apply at all, even if you wait until 55 or later to actually take the withdrawal. What matters is the age you were when you separated, not the age you are when you withdraw. [9][10] In that case, the 401(k) reverts to the standard 59½ threshold, the same result as if the Rule of 55 didn't exist, which strengthens the case for prioritizing the 457(b) for anyone who might leave public service earlier than that.
NOTE Confirm specifics with your plan administrator: the loan lookback calculation, whether the CalPERS 457 Plan and a local agency's 401(k) count as the “same employer” for aggregation, whether your role qualifies for the age-50 exception, and how the plan treats money rolled in from a 401(k) or IRA (which generally loses the 457(b)'s blanket penalty exemption) can all vary. [10]
Catch-Up Contributions and the 2026 Roth Rule
If you're 50 or older, both plans allow a catch-up on top of the standard limit: $8,000 for 2026 ($32,500 total per plan), or $11,250 if you'll turn 60 through 63 during the year ($35,750 total). [11] The 457(b) has one more option: a special catch-up in the three years before your plan's normal retirement age (the age your plan sets for this, not necessarily when you plan to retire) that may allow contributions up to double the standard limit, $49,000 for 2026, though it can't be combined with the age-based catch-up in the same year. [12]
NOTE One more 2026 change: if your prior-year FICA wages (wages subject to Social Security and Medicare tax) from your employer exceeded $150,000, age-based catch-up contributions must now be made as Roth rather than pretax; the 457(b)'s special three-year catch-up is currently exempt from that requirement. [13]
The Bottom Line
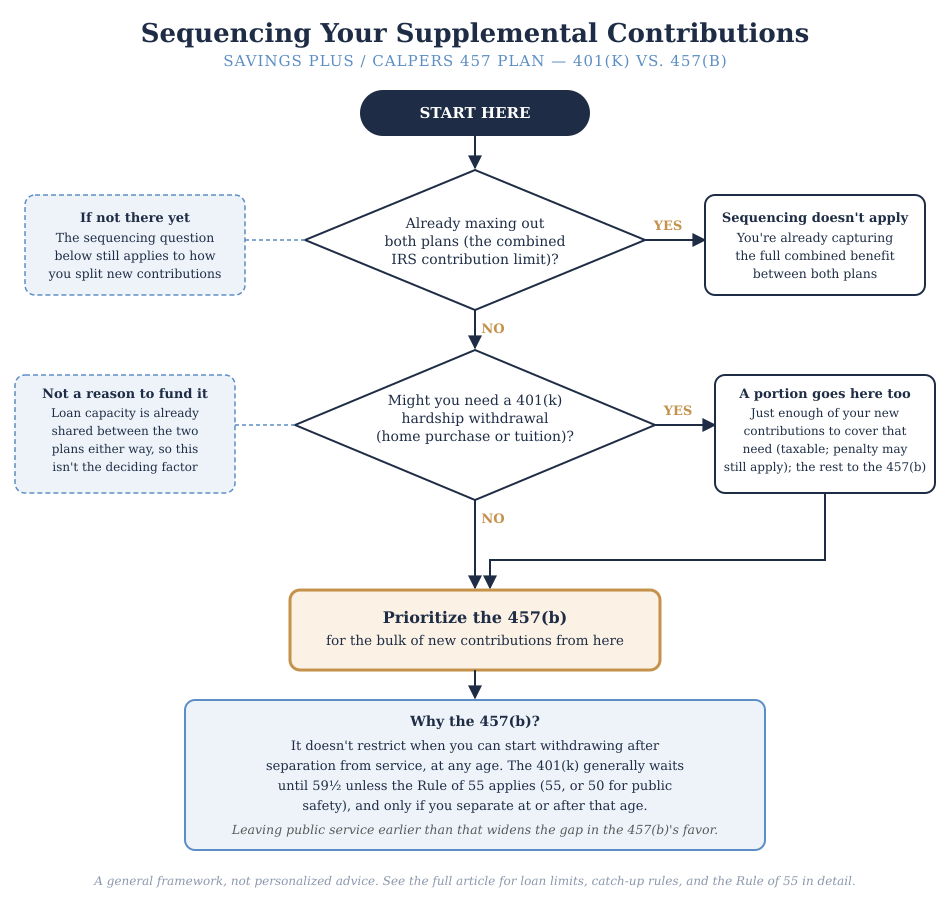
Put together, a workable framework looks like this: direct enough to the 401(k) to cover a plausible home purchase or tuition need, in case the hardship withdrawal option is ever necessary, and prioritize the 457(b) for the bulk of new contributions after that. The reasoning comes down to access, not capacity: the loan ceiling is shared between the two plans either way, so it doesn't favor one over the other. What favors the 457(b) is that it doesn't restrict when you can start withdrawing after separation from service, while the 401(k) generally does until 59½, unless the Rule of 55 applies (55 for most participants, 50 for qualified public safety employees). That difference matters most if you're aiming for an earlier retirement: the 457(b) removes the waiting period entirely, while the 401(k) only catches up once you reach the applicable age.
This is a framework, not a formula, and it assumes you're not already maxing out both plans. If you are, the sequencing question doesn't really apply, and deferring the full $49,000 combined, more with catch-up contributions, is a notable opportunity in its own right for higher-income households looking for more ways to defer current income. Otherwise, how this applies depends on your income, your timeline, whether the Rule of 55 or its public safety equivalent applies to you, and your plan's specific rules for catch-up contributions. This is where personalized analysis tends to matter.
Sources
[1] California Department of Human Resources, “Savings Plus Program,” calhr.ca.gov.
[2] CalPERS, “Deferred Compensation,” calpers.ca.gov/members/retirement-benefits/deferred-compensation.
[3] California State University, Fresno, Administration and Finance, “2026 Comparison Chart: 401(k) vs. 457(b).”
[4] California State University, Northridge, Human Resources, “Savings Plus Program.”
[5] Internal Revenue Service, “Issue Snapshot: Borrowing Limits for Participants with Multiple Plan Loans,” irs.gov (IRC §72(p)(2)(A)).
[6] Nationwide Retirement Solutions, “Savings Plus Loan Fact Sheet,” nrsforu.com.
[7] Internal Revenue Service, “401(k) Plan Hardship Distributions: Consider the Consequences,” irs.gov.
[8] Internal Revenue Service, “Retirement Plans FAQs on Designated Roth Accounts,” irs.gov.
[9] Internal Revenue Service, “Retirement Topics: Exceptions to Tax on Early Distributions,” irs.gov.
[10] Fidelity, “What Is the Rule of 55?” fidelity.com.
[11] Internal Revenue Service, “401(k) limit increases to $24,500 for 2026, IRA limit increases to $7,500,” irs.gov/newsroom.
[12] Nationwide Retirement Solutions, “IRS Contribution Limits,” nrsforu.com.
[13] Internal Revenue Service, “Retirement Topics: Catch-up Contributions,” irs.gov; Quarles Law Firm, “SECURE 2.0 Act Retirement Plan Update: Roth Catch-Up Contributions in 2026.”
Disclosures
Fiduciary Financial Advisors does not accept any liability for the use of the information discussed. Consult with a qualified financial, legal, or tax professional prior to taking any action. Before investing, consider investment objectives, risks, fees, and expenses. Investments in securities involve the risk of loss, including loss of principal. Past performance is no guarantee of future returns. The views and opinions reflected in the content are subject to change at any time without notice. The content speaks only as of the date indicated. Some information was obtained from external sources. The information is believed to be accurate, but there is no guarantee that it is.
This content is for educational purposes only and does not constitute personalized tax, legal, or investment advice. Consult a qualified CFP®, CPA, or attorney before taking action.
Fiduciary Financial Advisors is a registered investment adviser. Nothing here constitutes individualized investment advice. Examples are illustrative only and not recommendations. No guarantee of future results. Third-party data is not independently verified.
CFP® and CERTIFIED FINANCIAL PLANNER® are certification marks owned by the CFP Board.
Asset Location: Optimizing Your Investments For Tax Efficiency
Two portfolios can hold the same investments and still keep different amounts after taxes. The difference often comes down to asset location: which investments sit in your traditional, Roth, HSA, and taxable accounts. This piece walks through how each account type is taxed, the two lenses that guide placement decisions, and how to move an existing portfolio toward better location without triggering an avoidable tax bill along the way.
You’ve probably heard the investing basics: diversify your portfolio, keep costs low, stay invested for the long term. All solid advice. But there’s a less-talked-about strategy that may quietly improve your after-tax returns without necessarily changing what you’re invested in or taking on more risk. It’s called asset location, and it’s one of those planning details that tends to separate a thoughtful investment strategy from a generic one.
The concept is fairly simple: different types of accounts are taxed differently, and different types of investments generate different kinds of taxable income (or none at all). Asset location is the practice of deliberately matching your investments to the right account types, with the goal of reducing what you hand over to the IRS. It doesn’t change your overall asset allocation (your mix of stocks, bonds, alternatives, etc.), but it may noticeably improve how much of your return you actually keep.
Vanguard’s research suggests that a well-implemented asset location strategy may add between 0.05% and 0.30% of after-tax return annually,[1] which may compound into real dollars over time. More recent Vanguard research from October 2023 found that going a step further and optimizing placement of equity subclasses like U.S. vs. international and growth vs. value may add up to another 0.10% annually.[2] These are modeled estimates, not guarantees, and results will vary. But the potential is real enough to be worth understanding.
Start With the Accounts
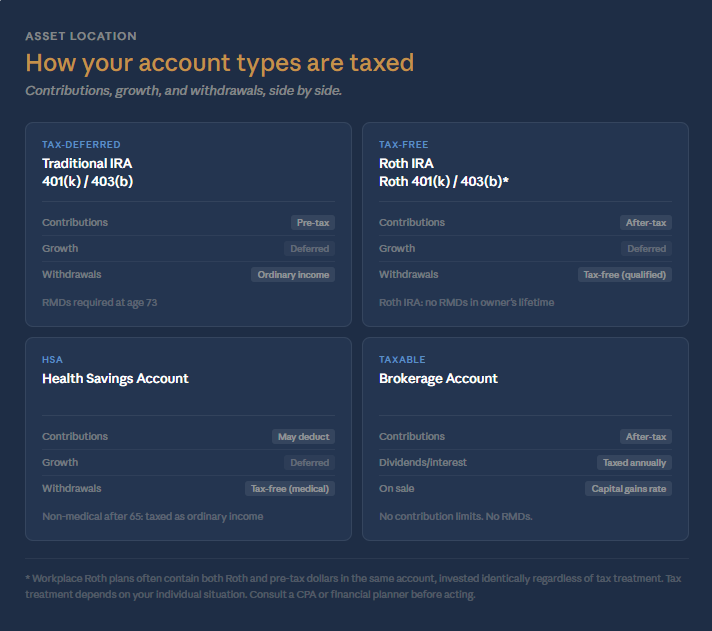
Before you can decide what goes where, it helps to understand the three main investment account types and how each one is generally taxed.
Tax-Deferred Accounts
Contributions to tax-deferred accounts (think traditional 401(k)s, IRAs, and 403(b)s) are typically made with pre-tax dollars, which may reduce your taxable income in the year you contribute. The money can grow without annual tax drag; you can generally buy, sell, and reinvest dividends inside the account without owing taxes on those transactions in the current year. The trade-off is that withdrawals in retirement are generally taxed as ordinary income. These accounts are also subject to required minimum distributions (RMDs) once you reach the required age. (Inherited IRAs come with their own RMD rules that often differ from those that apply to the original account owner, and are worth understanding separately if you’ve received or expect to receive one.)
Tax-Free Accounts
Roth accounts work differently. Contributions go in after-tax with no upfront deduction, but qualified withdrawals in retirement are generally tax-free, including all the accumulated growth. Roth IRA funds are not subject to RMDs during the account owner’s lifetime under current law. For these reasons, Roth funds may benefit the most from strong appreciation over time, since that growth may not be taxed upon qualified withdrawal.
One important nuance worth spelling out: workplace retirement plans like 401(k)s and 403(b)s often hold more than one tax type in a single account (even though it may be a Roth 401(k) or Roth 403(b) in name). Even when an employee is contributing to the Roth side, employer contributions are typically made on a pre-tax basis, meaning the same account may contain both Roth (after-tax) and pre-tax dollars. And because all funds in a workplace plan are invested through the same menu of options, everything is generally invested the same way regardless of the tax treatment of each dollar. That makes workplace plans poor candidates for implementing asset location within the account itself. It is one practical reason why rolling over retirement funds into IRAs, separating Roth dollars into a Roth IRA and pre-tax dollars into a Traditional IRA, may make sense over time, both from an asset location standpoint and for greater flexibility when managing distributions in retirement.
Health Savings Accounts (HSAs)
HSAs are sometimes lumped in with Roth accounts as “tax-free,” and for qualified medical expenses, they actually are. Contributions may be tax-deductible, the funds grow tax-deferred, and withdrawals for eligible healthcare costs are tax-free. That's a combination designed to address those specific planning goals.
As an investment vehicle for general retirement savings, though, HSAs have some real limitations worth keeping in mind. After age 65, you can withdraw HSA funds for any purpose, but non-medical withdrawals are taxed as ordinary income, similar to a traditional IRA. And the inheritance treatment is notably less favorable than a Roth IRA: when an HSA passes to a non-spouse beneficiary, the full account value is generally included in the beneficiary’s taxable income in the year of inheritance.[3] For these reasons, HSAs are often better suited to lower-volatility investments, particularly if the account could pass to heirs or if non-medical withdrawals in retirement are a realistic possibility.
Taxable Brokerage Accounts
Taxable accounts don’t offer upfront deductions or tax-free withdrawals, but they come with flexibility the other account types can’t match. There’s no contribution limit, no RMDs, and generally no restriction on when you can access the money. Investments held here are subject to capital gains tax when sold (at the generally lower long-term rate if held more than a year) and dividends may qualify for preferential tax rates as well.
The Two Lenses That Drive Asset Location
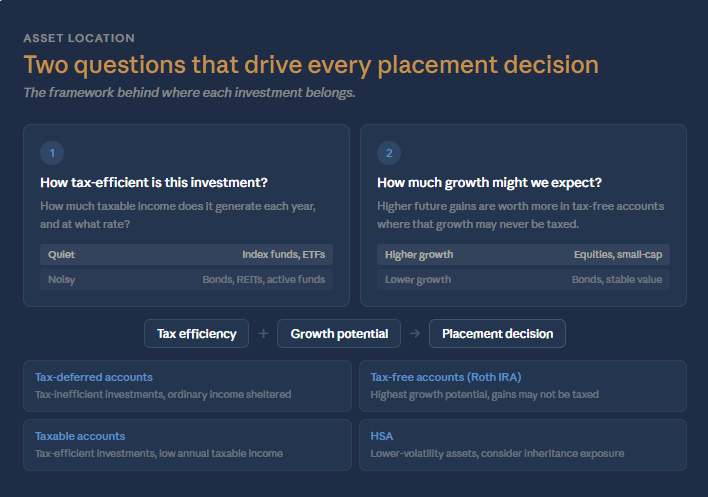
Once you understand the accounts, asset location decisions generally come down to two overlapping questions: How tax-efficient is this investment? And how much growth might we expect from it?
Lens 1: Tax Efficiency
Some investments are relatively quiet from a tax perspective. A broad U.S. stock market index fund, for example, typically has low turnover and mostly qualified dividends, meaning it may not generate much of an annual tax bill if held in a taxable account.
Other investments are noisier. Taxable bond funds generate interest income every year, and that interest is typically taxed at ordinary income rates, the same rates that apply to your wages. REITs (real estate investment trusts) present a similar consideration: a large share of their distributions are often treated as ordinary income rather than the more favorably taxed qualified dividends, though they may qualify for a 20% deduction on that income under the Tax Cuts and Jobs Act.[4] Actively managed equity funds with high turnover may also generate short-term capital gains distributions taxed at ordinary rates, rather than the lower long-term capital gains rate that applies to longer-held positions.
The principle that follows: investments that tend to generate a lot of ordinary income are often better placed in a tax-sheltered account, where that income may compound without an annual tax hit. Investments that tend to generate less taxable income, or income that qualifies for lower rates, may be a better fit in a taxable account.
Lens 2: Growth Potential
The second lens is about making the most of your tax-free space. Consider two scenarios: a Roth IRA that grows from $100,000 to $400,000 over time, where all of that $300,000 gain could be tax-free upon qualified withdrawal, versus that same $300,000 gain inside a traditional IRA, which would likely be taxed as ordinary income when withdrawn. All else being equal, you’d take the tax-free account. (Safe assumption.) So apply that thinking to how you allocate within each account: generally, you’d prefer your higher-growth investments to be in the accounts that may not tax the gains.
Higher-growth assets held over long accumulation periods are often considered good candidates to hold more of in Roth accounts, since their future gains may not be taxed upon qualified withdrawal. Conversely, lower-growth, income-producing assets like investment-grade bond funds are often reasonable fits for a traditional IRA. Withdrawals would generally be taxed as ordinary income, but bond interest in a taxable account would likely have been taxed at ordinary rates anyway. The net result is that tax-deferred shelter gets applied where it may provide the most benefit.
Putting It Together: A General Framework
Combining both lenses produces a rough framework, though your specific situation always matters:
•Tax-deferred accounts: Tilt toward investments that generate more ordinary income. Sheltering that income from annual taxation may help reduce tax drag over time.
•Tax-free accounts (Roth IRAs specifically): Tilt toward assets with stronger long-term appreciation potential, since qualified gains may not be taxed upon withdrawal. As noted above, this applies more cleanly to IRAs than to workplace plans, where the mixed tax nature of the account limits what you can do with asset location.
•Taxable brokerage accounts: Tilt toward tax-efficient assets that generate relatively modest annual taxable income, or assets that carry specific tax advantages that are only accessible when held in a taxable account.
As Fidelity has put it: “You can’t control market returns, and you can’t control tax law, but you can control how you use accounts that offer tax advantages.”[5]
Worth emphasizing: these are tilts, not rules. Asset location is a directional framework, not a rigid prescription. You don’t have to perfectly segregate every holding to get value from it. Holding some bonds in a taxable account, some equities in a traditional IRA, or some growth assets in an HSA doesn’t mean the strategy is broken. It means you’re working with real constraints, which is what everyone is doing.
If You’re Starting from an Existing Portfolio
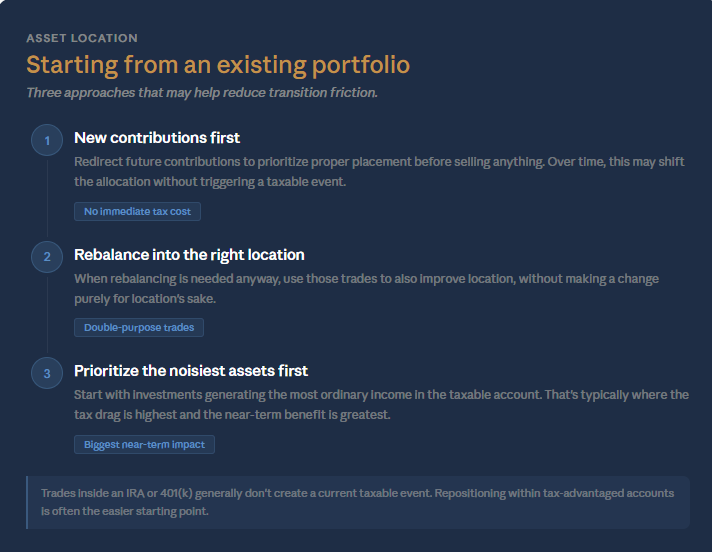
If your investments are already spread across multiple accounts and you haven’t been thinking about asset location, getting started isn’t always as simple as deciding where new contributions go. In many cases, moving toward a better-located portfolio will require selling some existing holdings and repositioning them into different accounts.
That transition has real costs. Selling appreciated investments in a taxable account to move them could trigger capital gains taxes. Depending on how long you’ve held those positions and your current bracket, that tax bill may offset some of the near-term benefit. There’s no universal answer here; it depends on the size of the embedded gain, your time horizon, and your current and expected future tax rates.
A few approaches that may help reduce transition friction:
•New contributions first. Redirect future contributions to prioritize proper placement before selling anything. Over time, this may help shift the allocation without triggering a taxable event.
•Rebalance into the right location. When the portfolio drifts, and rebalancing is needed anyway, use those trades to also improve location. Selling bonds in a taxable account and replacing them with equities while moving the bond exposure to a traditional IRA improves placement without making a change purely for location’s sake.
•Prioritize highest-income-generating assets first. If you can only reposition some holdings in the near term, start with the investments generating the most ordinary income in the taxable account. That’s typically where the tax drag is highest.
For investments already inside an IRA or 401(k), repositioning is generally simpler because trades within a tax-advantaged account don’t generate a current taxable event. If your bonds are sitting in a Roth IRA and your equities are in a traditional IRA, you may be able to swap the allocations without immediate tax consequences.
This is one area where working through the numbers with a financial planner tends to be worthwhile, since the right pace of transition often depends on a careful look at your specific situation.
Layering In Additional Strategies
Asset location works best as part of a broader tax-planning framework. Two strategies that pair naturally with it are tax-loss harvesting and Roth conversions.
Tax-loss harvesting involves strategically selling investments that have declined in value to realize a loss that may offset capital gains elsewhere in the portfolio, or up to $3,000 of ordinary income per year. Because harvesting plays out in taxable accounts, the composition of that account matters. A well-located taxable account holding tax-efficient equities tends to create more harvesting opportunities over time, since equity positions are more likely to experience periodic declines that may be harvested without significantly disrupting the overall strategy.
Roth conversions involve deliberately moving pre-tax dollars from a traditional IRA or 401(k) into a Roth account and paying taxes at today’s rate. Done systematically, particularly in lower-income years before RMDs begin, conversions may grow the pool of tax-free space available for higher-growth assets. These strategies may also reinforce each other: harvested losses in a taxable account can sometimes offset the income generated by a Roth conversion in the same year, potentially reducing the net tax cost of both.
I’ve written in more detail about Roth conversion strategies and the value of coordinated investment planning if either is useful context for how asset location fits in the bigger picture.

A Few Practical Caveats
Asset location tends to add the most value when you have solid balances across multiple account types. If your retirement savings are concentrated entirely in one type of account, there’s limited ability to optimize placement. The more diversity you have across taxable, traditional, and Roth accounts, the more flexibility you have to apply these principles.
Asset location is a portfolio-level strategy, not an account-level one. Each individual account will hold a different mix of investments and will likely perform differently in any given year. A bond-heavy traditional IRA will look very different from a Roth IRA holding primarily equities. If you evaluate each account in isolation, this may feel disorienting. The right lens is how all of your accounts perform together.
Related to that: these decisions don’t exist in a vacuum. Asset location works best when considered alongside your broader accumulation strategy (how you’re building assets across different account types over time), your distribution strategy (which accounts you plan to draw from first in retirement and in what sequence), and your anticipated cash flow needs in both the near and longer term. A placement decision that looks optimal on paper may be less so if it creates friction with how you plan to access the money, triggers unnecessary taxes when you need liquidity, or conflicts with a Roth conversion strategy you’re running in parallel.
As a practical example: it may make sense to hold a sizable bond position in a taxable account for a period of time if those funds are earmarked for a specific near-term purpose, but the time horizon is still longer than a savings account would warrant. That’s not a failure of the strategy; it’s a reasonable acknowledgment that liquidity needs and optimal placement don’t always line up perfectly. The framework is directional guidance, and real financial lives require flexibility.
Rebalancing also requires some coordination. When the overall portfolio drifts from its target allocation, getting it back on track ideally involves trades that don’t create unnecessary taxable events.
And finally: tax law changes. The favorable treatment of qualified dividends and the REIT pass-through deduction under the TCJA have already evolved, and may continue to. A solid asset location strategy is worth reviewing periodically rather than treating as a one-time setup.

The Bottom Line
Asset location may add real value, but it works best on top of a solid foundation: a diversified, low-cost portfolio with an asset allocation that fits your goals and time horizon. The strategy is an optimization layer, not a substitute for getting the fundamentals right first.
For investors who have multiple account types and are in higher tax brackets, the potential is worth taking seriously. Done thoughtfully, it generally comes down to intentional placement decisions made when accounts are funded and revisited as part of ongoing planning.
One honest reality: knowing the right strategy and actually implementing it, then continuing to monitor and maintain it over time, are two different things. If you know you’re unlikely to follow through on the mechanics on your own, or that periodic review tends to slip when life gets busy, working with an advisor as an accountability partner is a practical solution. Beyond building the initial plan, an advisor may help ensure that rebalancing, repositioning, and tax-layer decisions like loss harvesting and Roth conversions actually happen when the opportunity is there, rather than sitting on a to-do list indefinitely. I wrote more about that dynamic in Your Finances Called, if that resonates.
This is where personalized analysis tends to matter most, because the right approach depends on your specific account balances, tax situation, investment mix, and time horizon.
Sources
1. Vanguard, “Asset Location Can Lead to Lower Taxes,” Vanguard Investor Education. investor.vanguard.com
2. Sachin Padmawar et al., “Asset Location for Equity,” Vanguard Research, October 2023. corporate.vanguard.com
3. Internal Revenue Code § 223; IRS Publication 969, Health Savings Accounts and Other Tax-Favored Health Plans. Regarding HSA inheritance: IRC § 223(f)(8); upon death, a non-spouse beneficiary must include the fair market value of the HSA in gross income in the year of the account holder’s death.
4. Internal Revenue Code § 199A; Tax Cuts and Jobs Act of 2017 (P.L. 115-97). The 20% deduction on qualified REIT dividends is currently scheduled to expire after December 31, 2025, absent Congressional action.
5. Andrew Bachman, Director of Financial Solutions, Fidelity Investments, as cited in Fidelity Viewpoints, “Asset Location: Investing in the Right Accounts.” fidelity.com
Disclosures
The information contained in this article is intended for educational purposes only and does not constitute tax or investment advice. Asset location strategies depend on individual circumstances including account balances, tax situation, investment mix, and time horizon. Results discussed in this article are illustrative and modeled; they are not guarantees of future performance. Please consult a qualified financial and/or tax professional for guidance specific to your situation. Tax laws are subject to change; the TCJA provisions referenced, including the Section 199A deduction, are subject to Congressional action beyond 2025.
Investment advisory services are offered through Fiduciary Financial Advisors, a registered investment adviser. This article is for informational and educational purposes only and should not be construed as personalized investment, tax, or legal advice. Any references to scheduling a consultation are for general informational purposes and do not create an advisory relationship. Third-party research, statistics, and survey data cited are believed to be reliable but have not been independently verified. All data is subject to change. References to CFP® professionals relate to industry research and do not imply that any specific outcome will be achieved.
Certified Financial Planner Board of Standards, Inc. (CFP Board) owns the CFP® certification mark in the United States, which it authorizes use of by individuals who successfully complete CFP Board’s initial and ongoing certification requirements.

You Left Your CalPERS Employer. Now What?
You've left your CalPERS-covered job before retirement, and now your benefits are in question. This plain-language guide walks through vesting, your three options at separation (leave contributions on account, take a refund or rollover, or retire now), and how reciprocity works if you're heading to another California public employer.
A plain-language guide to your options when you leave a CalPERS-covered job before you're ready to retire

Maybe you landed a role in the private sector. Maybe you relocated for family reasons. Maybe the job just wasn't the right fit anymore. Whatever happened, you've left your CalPERS-covered employer before retirement, and now you have the question: what actually happens to the benefits you've been building?
The short answer is that CalPERS doesn't disappear from your life. This article walks through those choices in plain language so you can make an informed decision rather than a default one.
What You've Built
When you work for a CalPERS-covered employer, two things are happening in your account at the same time. First, you're making employee contributions, which are a percentage of your salary set by your retirement formula and membership tier. Second, your employer is making its own contributions on your behalf into the broader fund. Only the first bucket (your own contributions plus the interest they've earned) is refundable to you. Employer contributions aren't yours to take with you; they go toward funding pension benefits for current and future retirees across the system.[1]
The pension benefit itself, that lifetime monthly payment you've heard described as "2% at 62" or "2.7% at 57" or some similar formula, isn't funded from a personal account the way a 401(k) is. It's a defined benefit: a promise from CalPERS to pay you a calculated amount for life once you reach eligibility.[2]
Are You Vested?
Your vesting status is the key factor in understanding your options. CalPERS uses a two-part test: you need both sufficient service credit and minimum age to collect.[3]
The Service Credit Side
For most CalPERS members, the vesting threshold is five years of CalPERS-credited service. There are some exceptions, most notably for State of California Second Tier employees, who generally need 10 years, but the five-year mark applies to the large majority of members working for state agencies, cities, counties, etc.[3]
If you've crossed that five-year threshold, you're considered vested in the pension side of things, meaning the right to a future benefit is locked in regardless of where you work next. If you haven't yet hit five years, you don't have a right to a future pension unless you return to CalPERS-covered employment, use reciprocity with another qualifying public retirement system, or had part-time status that qualifies under a specific exception.
The Age Side
Vesting in the service credit sense doesn't mean you can start collecting tomorrow. You also have to reach the minimum retirement age for your formula, which varies depending on when you became a CalPERS member:[4]
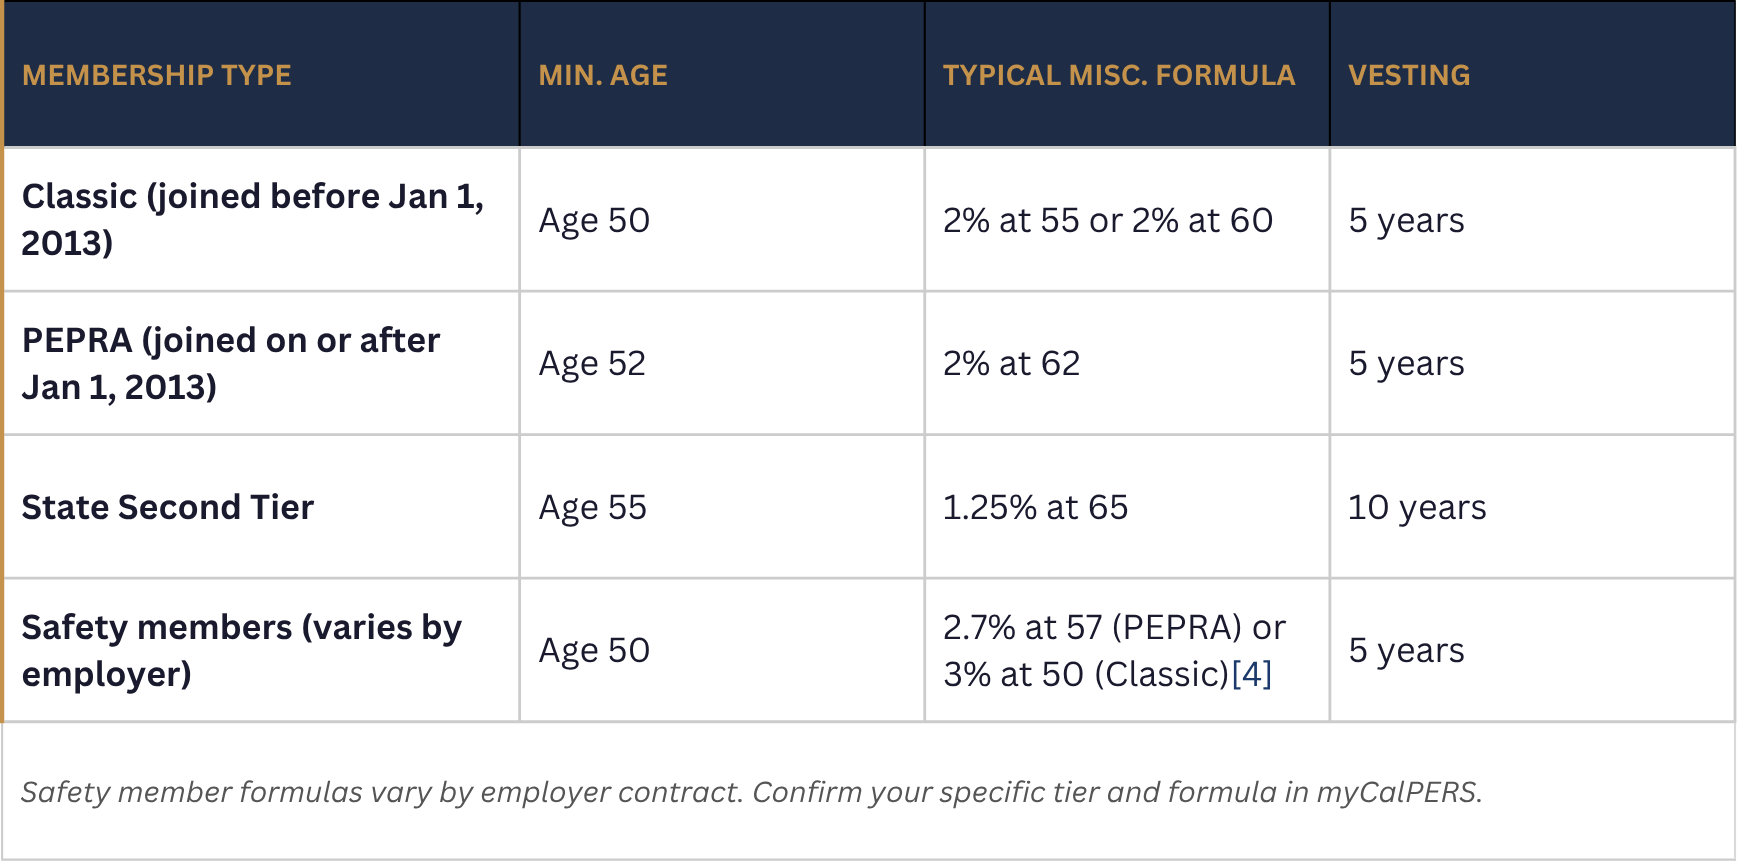
So, for example, if you're a 38-year-old Classic miscellaneous member with eight years of service credit and you leave your employer today, you're vested in the service credit sense, but you can't collect until you reach at least age 50. That gap, between your separation date and your earliest retirement eligibility date, is what makes the decisions below so consequential.
Your Three Main Options at Separation
Once you've permanently left all CalPERS-covered employment, CalPERS will mail you a document called Options at Separation. It lays out what comes next. In practice, you have three paths.[5]
Option 1: Leave Your Contributions on Account
You can leave your employee contributions exactly where they are, earning interest, until you reach minimum retirement age and choose to retire. CalPERS credits accounts left on deposit with interest at a rate of 6% per year, and your membership and service credit remain fully intact.[6]
If you're vested, this approach preserves your right to a lifetime pension payment starting at minimum retirement age. The pension amount you'd eventually receive is based on your service credit at separation, your final compensation, and your age when you actually retire. You won't earn additional CalPERS service credit during the years you're working elsewhere, but the credit you built doesn't evaporate.
One thing to know about this option: under federal Required Minimum Distribution rules, if you haven't retired or refunded your account, CalPERS will eventually require a distribution. The age threshold depends on your birth year: age 73 for those born between 1951 and 1959, and age 75 for those born in 1960 or later.[7] If you're leaving public employment mid-career, that deadline is likely far enough away to not be a factor in the initial decision.
Option 2: Take a Refund or Roll Over Your Contributions
You can request a refund of your employee contributions and the interest they've earned. This terminates your CalPERS membership. Once you choose this path, you forfeit your right to any future pension benefit, disability retirement, or survivor benefits under CalPERS.[8]
The refund is taxable as ordinary income unless you roll it over into a qualified retirement account (an IRA or an eligible employer plan that accepts rollovers). If you receive the money directly, CalPERS is required to withhold 20% for federal income tax, and you may face an additional 10% early withdrawal penalty if you're under 59½ and don't roll the funds over.[9]
If you later return to CalPERS-covered employment and want to buy back your prior service credit, you can do so, but the cost is typically higher than what you were originally refunded, and it increases over time as interest accrues.[8]
Option 3: Retire Immediately (If You're Eligible)
If you've reached minimum retirement age and have at least five years of service credit, you may be eligible to apply for retirement now rather than deferring it.[4] This tends to come up most often for members who've spent a longer career in public service, or who are separating later in their working years.
Retiring at the minimum age typically means accepting a lower benefit factor than if you waited, since most CalPERS formulas are structured to reward retiring later. It also means your CalPERS health benefits question comes into focus immediately (more on that below). For many people, the timing question of when to start CalPERS benefits involves a breakeven analysis that intersects with Social Security timing, other savings, and healthcare coverage, so it pays to run those numbers before making the call.
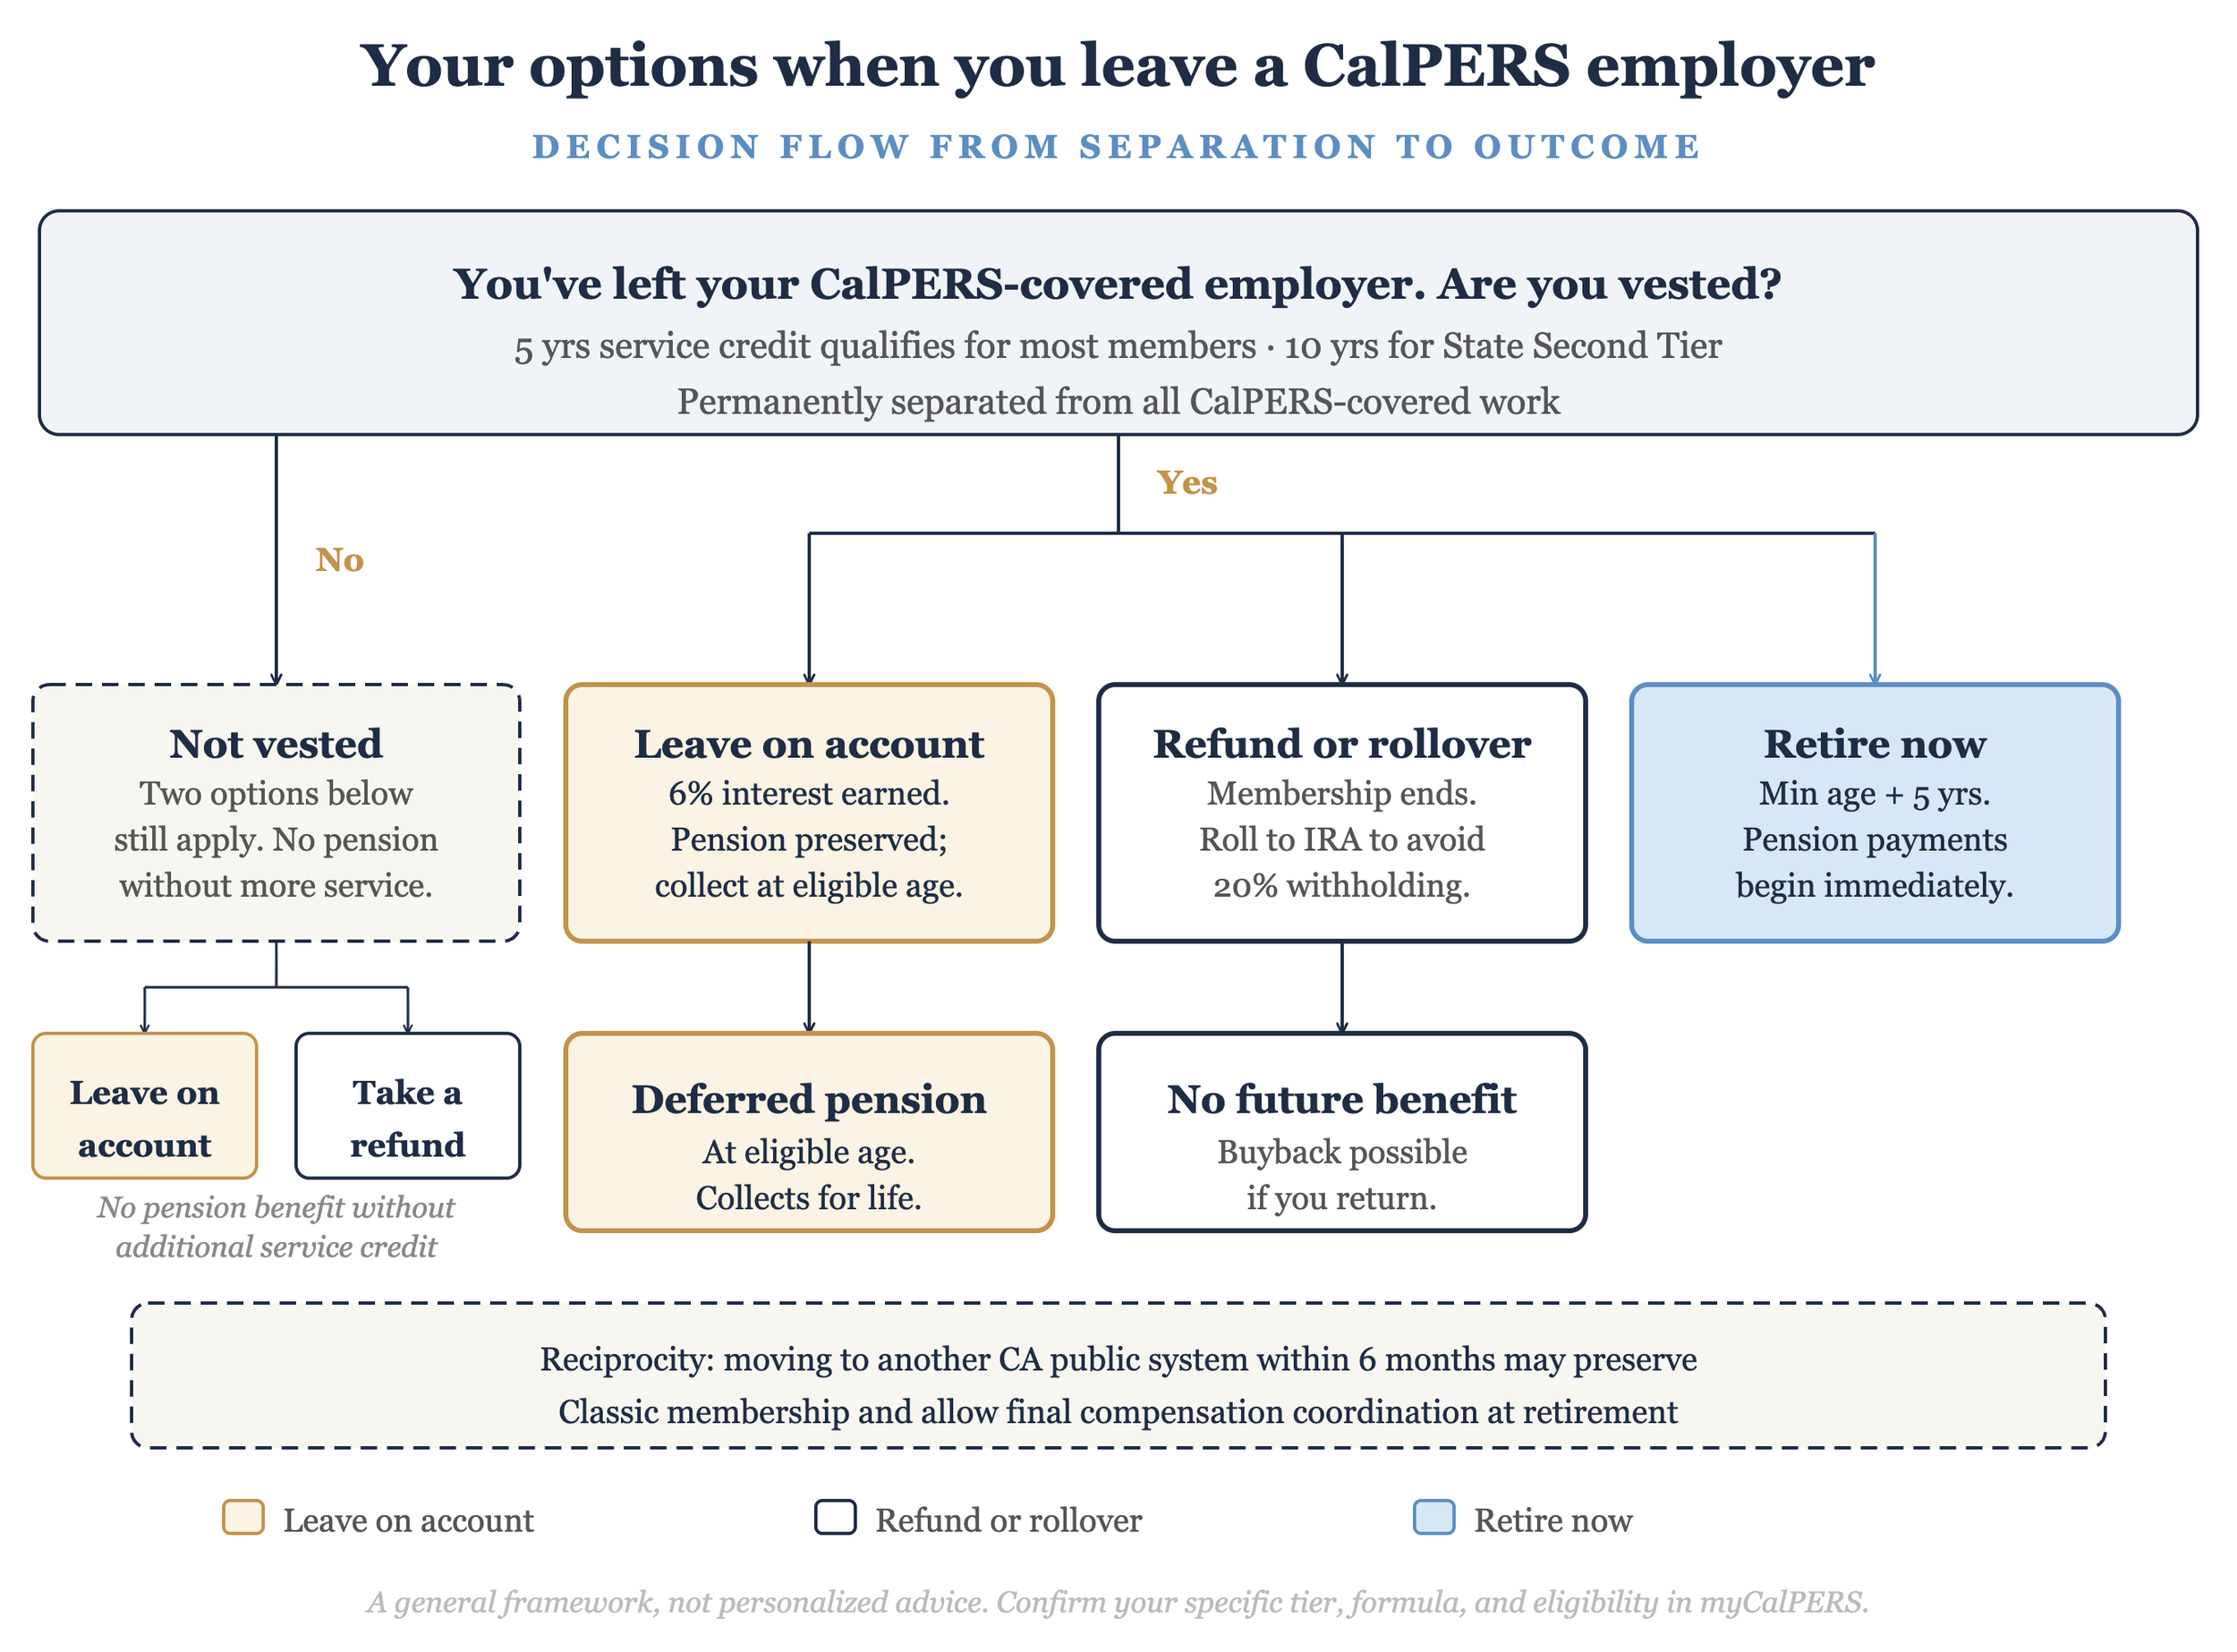
Reciprocity With Another Public Retirement System
If you're leaving one public employer and heading to another, or you're considering it, CalPERS has reciprocal agreements with most other California public retirement systems. Reciprocity allows you to coordinate benefits between systems in a way that tends to be more favorable than treating them as entirely separate.[14]
The mechanics work like this: there's no transfer of funds or service credit between systems. Instead, when you retire from both systems simultaneously (using the same retirement date), your highest final compensation from either system can be used to calculate the pension from each. You draw separate retirement payments from each system.[14]
To establish reciprocity, the main rule to know is the six-month window: you need to move from one reciprocal system to the next within six months, without a gap in active membership.[15] If you take more than six months off before joining a new public employer, reciprocity likely won't apply.
Reciprocity also affects your CalPERS membership tier. Classic members who move to another CalPERS-covered employer within six months typically retain their Classic membership status, which matters quite a bit given the more generous formulas Classic tiers carry relative to PEPRA.[16]
Reciprocal systems include, but are not limited to Other CalPERS-covered employers (which automatically share membership); CalSTRS (California State Teachers’ Retirement System); County “1937 Act” systems such as LACERA, SCERS, and others; San Francisco Employees’ Retirement System (SFERS); and various other qualifying California public retirement systems. If you’re moving to a position under one of these systems, ask both systems about reciprocity before your start date.
What to Think Through Before You Decide
The options at separation aren't equally consequential for everyone. Here is what you should think through:
• Are you vested? If you haven't hit five years of service credit, your options look different than if you have. A non-vested member taking a refund isn't forfeiting a pension they'd otherwise have. A vested member doing the same often is.[3]
• How long until minimum retirement age? The longer the runway, the more you want to think carefully about whether leaving contributions on account makes sense.[4]
• Will you return to public sector work? If there's any realistic chance you'll come back to a CalPERS employer, keeping your membership intact is probably the better decision. Service credit is additive, and buying it back later is expensive.[8]
• What's the reciprocity picture? If you're heading to another California public employer, verify the six-month window and establish reciprocity before your start date. This is one of the decisions that's easy to get right.[15]
• What does your retirement income picture look like overall? CalPERS pension income, if it's eventually payable, is one piece of a broader picture that often includes Social Security, your Savings Plus Program (which is comprised of a 457(b) and 401(k) plan), or other deferred compensation balance, and non-retirement savings. The refund decision looks different depending on what else is in that picture.
• What's the tax impact of a refund? If you're taking a refund in a year with high other income, the tax drag can add up. If you're in a lower-income year, the impact is more manageable. Rolling into an IRA avoids current taxation but still closes the CalPERS door.[9]
Don't Lose Track of Your Account
CalPERS will send you an Annual Member Statement every fall, but those go to the address on file. Keep your contact information current in myCalPERS, and check your account periodically, especially as you approach your eligible retirement window.[17]
This is where it gets personal.
The choice between leaving contributions on account, taking a refund, and establishing reciprocity intersects with your tax situation, your other retirement savings, your career plans, and how you model lifetime income. The right answer depends on the details of your situation. If you've recently left a CalPERS-covered employer and want to think through your specific numbers, I'm happy to help you work through it.
Sources
1. CalPERS. "Refund Member Contributions." calpers.ca.gov/page/active-members/retirement-benefits/refund-member-contributions
2. CalPERS. "Service & Disability Retirement." calpers.ca.gov/members/retirement-benefits/service-disability-retirement
3. CalPERS PERSpective. "CalPERS 101: Your Pension and the Vesting System." news.calpers.ca.gov/your-calpers-pension-is-on-a-vesting-system-heres-what-that-means
4. CalPERS. "Options at Separation" (PDF). calpers.ca.gov/documents/options-at-separation/download
5. CalPERS. "Options at Separation" letter (PDF). calpers.ca.gov/documents/options-at-separation/download
6. CalPERS. "A Benefits Guide for Public Agency Members" (PDF). calpers.ca.gov/documents/new-member-public-agency-guide/download
7. SECURE 2.0 Act of 2022; IRS Final Regulations on Required Minimum Distributions (89 Federal Register 58886, eff. Jan. 1, 2025). federalregister.gov/documents/2024/07/19/2024-14542/required-minimum-distributions
8. CalPERS. "Refund Member Contributions." calpers.ca.gov/page/active-members/retirement-benefits/refund-member-contributions
9. CalPERS. "Refund Election Form Packet — Special Tax Notice: Your Rollover Options" (PDF). calpers.ca.gov/documents/refund-election-form-packet/download
10. CalPERS. "Eligibility & Enrollment (Active Members)." calpers.ca.gov/members/health-benefits/eligibility-and-enrollment
11. CalPERS. "COBRA Coverage." calpers.ca.gov/members/health-benefits/eligibility-and-enrollment/cobra
12. CalPERS. "Eligibility & Enrollment (Retirees)." calpers.ca.gov/retirees/health-and-medicare/eligibility-and-enrollment
13. CalPERS PERSpective. "Health Vesting 101." news.calpers.ca.gov/health-vesting-101/
14. CalPERS. "Reciprocity (Linking Retirement Systems)." calpers.ca.gov/members/retirement-benefits/reciprocity
15. CalPERS PERSpective. "What You Need to Know About Reciprocity." news.calpers.ca.gov/what-you-need-to-know-about-reciprocity-2/
16. CalPERS. "Public Employees' Pension Reform Act (PEPRA)." calpers.ca.gov/page/about/laws-legislation-regulations/public-employees-pension-reform-act
17. CalPERS. "A Benefits Guide for Public Agency Members" (PDF). calpers.ca.gov/documents/new-member-public-agency-guide/download
Disclosures
Fiduciary Financial Advisors does not accept any liability for the use of the information discussed. Consult with a qualified financial, legal, or tax professional prior to taking any action. Before investing, consider investment objectives, risks, fees, and expenses. Investments in securities involve the risk of loss, including loss of principal. Past performance is no guarantee of future returns. The views and opinions reflected in the content are subject to change at any time without notice. The content speaks only as of the date indicated. Some information was obtained from external sources. The information is believed to be accurate, but there is no guarantee that it is.
This content is for educational purposes only and does not constitute personalized tax, legal, or investment advice. Consult a qualified CFP®, CPA, or attorney before taking action.
Fiduciary Financial Advisors is a registered investment adviser. Nothing here constitutes individualized investment advice. Examples are illustrative only and not recommendations. No guarantee of future results. Third-party data is not independently verified.
CFP® and CERTIFIED FINANCIAL PLANNER® are certification marks owned by the CFP Board.

Market Commentary: Midyear 2026
The S&P 500 closed the first half of 2026 up 10.21%, but the path was anything but smooth. A new Fed chair, an Iran war that pushed oil past $100, and growing scrutiny of AI earnings concentration all shaped the six months, and may shape the next. Here's a look back, plus the portfolio questions worth asking now.
Four Themes Shaping the First Half of 2026

In the first half of 2026, there was plenty of news, but a few different themes in particular stand out to me: a war in the Middle East that unsettled energy markets for months, a new Federal Reserve chair who took a more cautious stance than expected (given the current administration’s pressure), and growing scrutiny of the artificial intelligence (AI) theme that has driven so much of the market's recent gains, both in how AI is being used inside companies and how AI-related revenue is being generated among the largest technology firms.
Through it all, the Standard & Poor's 500 (S&P 500) finished the first half up 10.21% on a price basis[1], a number that hides how uneven the path to get there actually was. This commentary walks through these threads that influenced the first six months of the year and may continue to shape the second.
Federal Reserve and Interest Rates
Jerome Powell's term as Fed chair ended on May 15. Kevin Warsh, confirmed by the Senate in a 54-45 vote, was sworn in on May 22.[2] He was widely viewed as the more rate-cut-friendly, reform-minded choice, having criticized the Fed's communication habits, argued for a smaller balance sheet, and suggested AI would help bring inflation down over time[3]. Though it's notable that Powell remains on the board as a voting member, a dynamic that adds another layer of uncertainty to how policy debates may unfold in the second half.
On June 17, the Federal Open Market Committee (FOMC) held rates steady at 3.50% to 3.75% for a fourth consecutive meeting. Warsh shortened the post-meeting statement, removed language signaling the Fed's future intentions, and declined to submit his own interest rate forecast, consistent with his stated skepticism of the exercise.[4] The other eighteen participants, however, leaned more strongly toward keeping rates higher than expected, with several now projecting at least one rate hike by year-end, a reversal from the rate cut the median projection had implied as recently as March.[5] The reasoning: inflation has proven stickier than hoped, with the Consumer Price Index (CPI) running 3.8% year over year in April, the highest since 2023, and the core Personal Consumption Expenditures (PCE) index, the Fed's preferred inflation gauge, moving from 3.0% to 3.3% over the same stretch.[6] (This is still nowhere near the 9.1% peak CPI hit in June 2022, the highest reading in roughly 40 years, which triggered the Fed to raise rates from near zero to over 5% in just about a year and a half.[22]) Energy prices tied to the Iran war are a sizable part of that story, layered on top of a labor market still adding jobs at a pace that gives the Fed little urgency to ease.
A practical note for rate watchers: for those who have been waiting on a rate drop to refinance and lower your monthly payment, that wait could run longer than expected. A mortgage recast is an option for anyone sitting on a lump sum in the interim, since it doesn't depend on rates moving at all. It keeps your existing rate and loan term but applies a sizable principal payment to the balance, then recalculates the monthly payment based on what's left owed, all without the appraisal, credit check, or closing costs of a full refinance. It's typically only available on conventional loans and usually carries a modest processing fee.
Middle East Conflict and Market Impact
On February 28, the United States and Israel launched a joint operation against Iran that killed Supreme Leader Ali Khamenei and opened a regional war that also reignited the Israel-Hezbollah conflict in Lebanon.[7] Iran responded in part by closing the Strait of Hormuz, the waterway carrying roughly 20% of the world's seaborne oil and liquefied natural gas (LNG). Shipping traffic fell more than 90% in the weeks that followed.[8]
Energy markets bore the brunt of it. Brent crude jumped from about $71 to $77 a barrel within days of the first strikes, eventually breaking $100, while West Texas Intermediate (WTI) crude peaked near $113 in April. By mid-June, prices had retreated toward the high $70s as ceasefire talks progressed, though Hormuz traffic still has not returned to pre-war levels, and full normalization isn't expected until 2027 even under an optimistic scenario.[9]
Equity markets moved in step with the headlines, selling off through much of March as the conflict widened, then surging when a ceasefire was first announced on April 8, with the Dow gaining over 1,300 points and the S&P 500 up 2.5% that day alone.[10] The United States and Iran signed an agreement on June 17 that paused large-scale hostilities, but it has been tested repeatedly since: a drone strike on a cargo ship on June 25, a U.S. response the next day, Iranian missiles and drones aimed at U.S. bases in Kuwait and Bahrain, and a second ship hit and a second night of U.S. strikes on June 27.[11]
This is the second time in just over a year that an Iran-related conflict has rattled markets, which makes it a useful moment to revisit how markets have historically absorbed military shocks. The two charts illustrate the longer-term picture.
In addition to the charts shown from JP Morgan and Dimensional Fund Advisors, research from LPL and Hartford Funds, looking across dozens of post-World War II shocks, finds an average decline of roughly 5% following a geopolitical event, with markets typically bottoming within about three weeks and recovering within one to two months, and the S&P 500 historically higher a year out about 70% of the time. J.P. Morgan's research group found a similar pattern across seventeen modern conflicts dating back to the Korean War: the S&P 500 sat modestly below its pre-conflict level a year out, then stood roughly 14% above the conflict-month level two years later.[12] The 2026 episode has tracked that pattern reasonably well so far, even though the International Energy Agency has described the disruption to oil markets as the largest in the industry's history.[13]
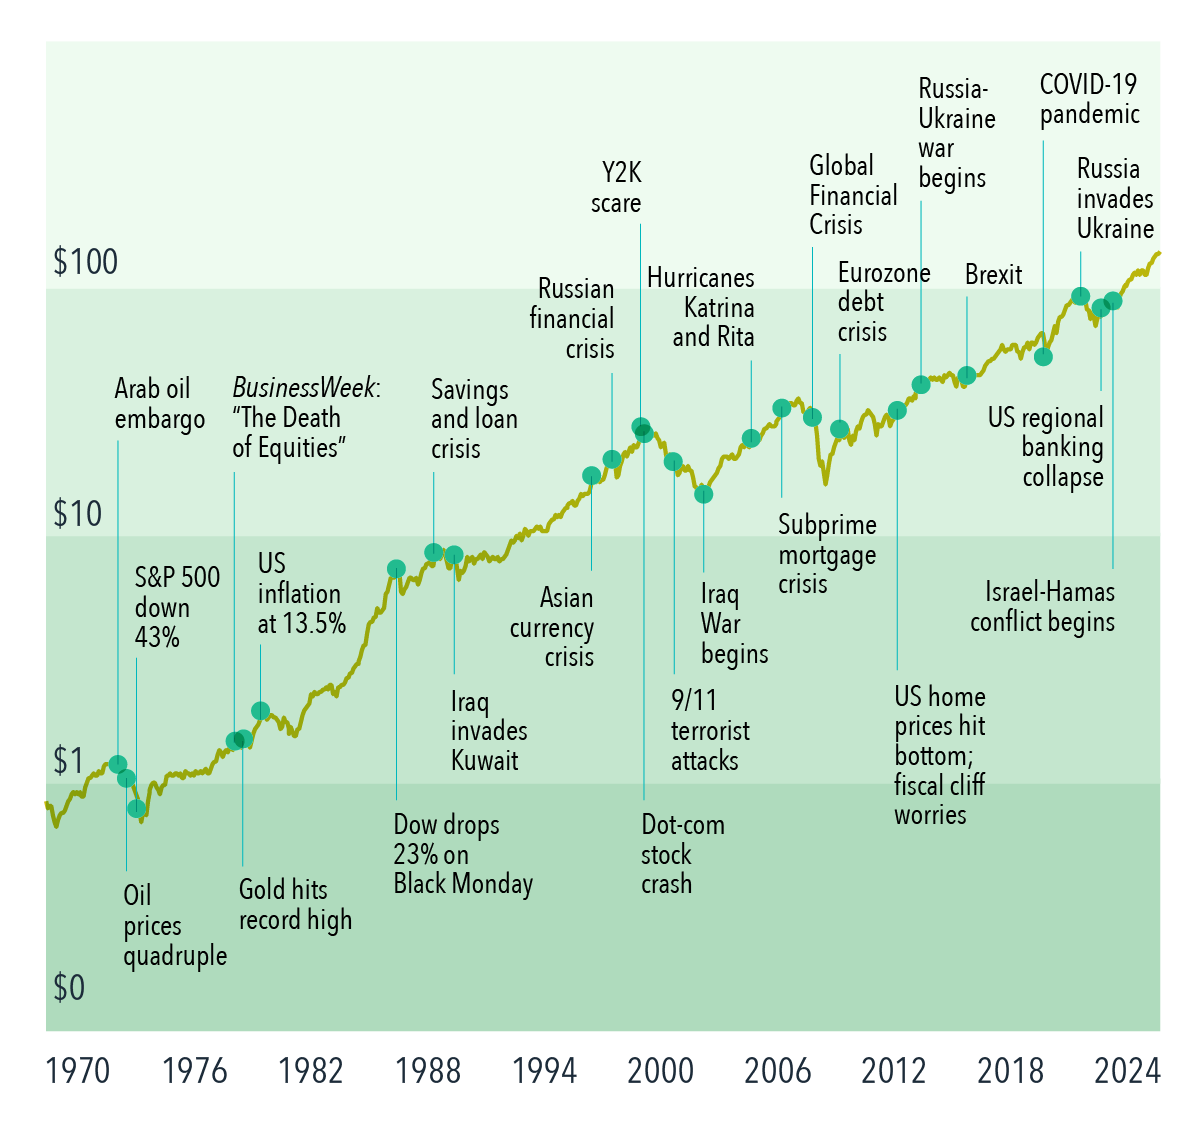
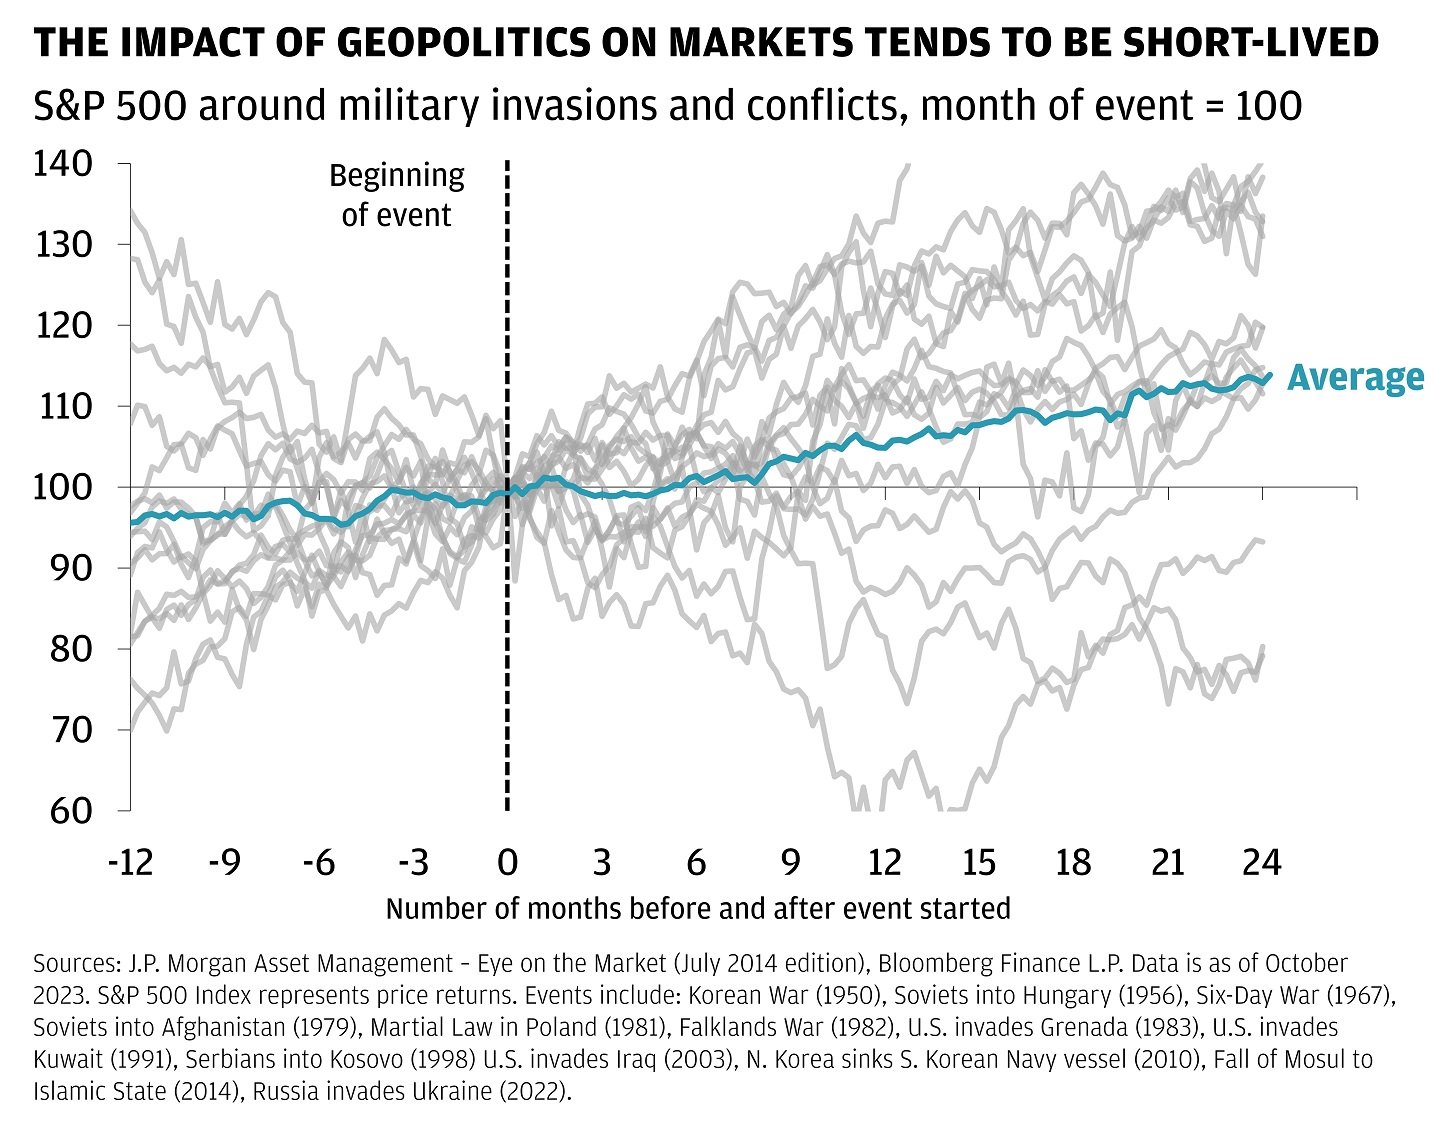
S&P 500 around military conflicts (month of event = 100)
Artificial Intelligence and Productivity
A widely discussed report from Glean, the Work AI Index 2026, surfaced interesting findings. By the survey's count, 87% of knowledge workers now use AI at work, 73% say it makes them more productive, and the average reported time savings comes to 13 hours a week. Those are individual self-assessments, however. When it comes to actual organizational outcomes, only 13% of those same workers say their organization is performing better as a result, suggesting that individual time savings are not automatically translating into measurable business improvements.[14] Glean's head of Work Innovation, Rebecca Hinds, has a name for part of the gap: “bot sitting,” the roughly 6.4 hours a week employees spend feeding context to AI systems, correcting their output, and cleaning up after them, invisible labor that eats into the time AI was supposed to free up. Sixty-nine percent of workers admit they have shipped AI-generated work they could not explain or defend if asked, a pattern the report labels “bot slop.”[15]
The dynamic is showing up in corporate budgets, too. Uber reportedly exhausted its 2026 AI tools budget well ahead of schedule due to higher than anticipated costs, and one technology executive noted that at some companies, the cost of the compute now runs ahead of the cost of the employees it was meant to support.[16] For investors, the relevant question isn't whether AI tools are useful; it's whether the productivity gains baked into AI-related earnings and capital spending assumptions are translating as cleanly as advertised. If a sizable share of “time saved” is being reallocated to managing the tools rather than higher-value work, the payback period on enterprise AI spending may run longer, and less predictably, than current stock market valuations assume.
AI Earnings Concentration Risk
A small group of companies, Nvidia, Microsoft, OpenAI, Oracle, Advanced Micro Devices (AMD), and CoreWeave among them, have built an increasingly interconnected web of investments and purchase commitments, where a sizable share of one company's revenue traces back to another company's investment in it.[17] Nvidia has committed up to $100 billion to OpenAI, which in turn uses Nvidia chips to build out data centers. Microsoft's roughly $13 billion stake in OpenAI has been delivered largely as Azure cloud credit, which OpenAI spends back with Microsoft. Oracle's $300 billion infrastructure agreement with OpenAI is filled mostly with Nvidia hardware, and Nvidia holds a stake in CoreWeave while supplying it chips, even as OpenAI holds its own stake in CoreWeave while buying its cloud capacity.[18]
Supporters call this a strategic necessity given how capital-intensive AI infrastructure has become and how scarce advanced chips remain.[19] Critics see something closer to the vendor financing arrangements of the dot-com era, in which companies effectively funded their own customers' purchases to inflate the appearance of organic demand. Investor Michael Burry, whose early, contrarian bet against the 2008 housing market was dramatized in the film The Big Short (one of my favorites if you haven't seen it), began shorting Nvidia and Palantir in late 2025 on similar grounds, and reiterated the comparison again in May.[20] Tech sector bond issuance reached roughly $428 billion in 2025, the cost of insuring against default by Oracle and Microsoft has nearly doubled since last fall, and Goldman Sachs recently raised its 2026 AI capital spending estimate to about $527 billion.[21] Whether this amounts to a bubble likely comes down to whether external, organic demand for AI products catches up to the revenue being generated inside this closed loop. If it does, the arrangement looks like ordinary supply chain financing. If it doesn't, the unwind could be sharp, given how concentrated these companies have become within major indexes.
Index Returns
Index / Indicator YTD Returns Through 6/30/2026
S&P 500 Index +10.21%
Russell 2000 Index (small caps) +22.57%
MSCI All Country World ex USA (international stocks) +13.05%
MSCI Emerging Markets Index +23.85%
Bloomberg U.S. Aggregate Bond Index +1.15%
Bloomberg Municipal Bond Index +2.32%
Dow Jones Global Select REIT Index (real estate) +13.32%
Index returns sourced from Dimensional Fund Advisors Periodic Performance Report, 1/1/2026 – 6/30/2026.
Treasury Yields as of July 1, 2026
Yields (as of 7/1/2026)
Fed Funds Target Rate 3.75%
3-Month Treasury 3.85%
6-Month Treasury 4.00%
2-Year Treasury 4.17%
5-Year Treasury 4.24%
10-Year Treasury 4.48%
30-Year Treasury 4.97%
Treasury yields sourced from U.S. Department of the Treasury via Charles Schwab, as of July 1, 2026. Index returns are for illustrative purposes and do not reflect the returns of any actual investment. Past performance is not indicative of future results.
The S&P 500 finished the first half of the year up 10.21%, but the broader return picture tells a more interesting story. Emerging markets (+23.85%), small-cap U.S. stocks via the Russell 2000 (+22.57%), and international developed stocks (+13.05%) all outpaced the S&P 500 by a wide margin, a theme covered in more depth in my recent article, Is the S&P 500 Really All You Need?. Bonds were positive but modest, with the Bloomberg U.S. Aggregate returning 1.15%. On the yield side, the 2-year Treasury at 4.17% sitting above the Fed Funds rate of 3.75%, and the 30-year rate approaching 5% signals a more normal-looking yield curve compared to recent years, when shorter-term rates were running even with or above long-term rates.
Portfolio Considerations
None of these stories are reason for alarm for a diversified investor, nor are they the whole story (I didn’t even touch on SpaceX's record IPO, which the initial stock prices arguably imply that its newer AI and computing bets pay off years down the line.) However, they raise a few questions worth considering:
1. How much of my equity exposure rides on a small number of mega-cap technology companies, and am I comfortable with that level of concentration if AI-related earnings growth slows?
2. Does my fixed income allocation account for a higher-for-longer, and possibly higher-still, rate environment, rather than the rate cuts that looked likely at the start of the year?
3. Has my time horizon or risk tolerance shifted in a way my portfolio hasn't caught up to yet?
4. If markets got bumpy over the next year or two, do I have enough in liquid reserves (keeping in mind that a diversified fixed income allocation can serve as a longer-term buffer) that I wouldn’t need to sell equity holdings to cover an unexpected expense or income disruption?
These are exactly the kinds of questions to work through together, in the context of a full financial picture rather than headline by headline.
Sources
1. Dimensional Fund Advisors, Periodic Performance Report, Monthly: 1/1/2026 – 6/30/2026, as of June 30, 2026. Index returns are for illustrative purposes and do not reflect the performance of any actual investment.
2. NPR, "Senate confirms Kevin Warsh as next chair of the Federal Reserve," May 13, 2026; Federal Reserve Board press release, May 15, 2026; Brookings, "Who has to leave the Federal Reserve next?"
3. CNN Business, "Kevin Warsh nominated by Trump to be the next Federal Reserve chair," January 30, 2026; CCN, "Kevin Warsh Officially Replaces Fed Chair Jerome Powell," May 17, 2026.
4. CNBC, "Fed interest rate decision June 2026: Fed holds rates steady," June 17, 2026; Lord Abbett, "June Fed Meeting: Policy Signals from the New Chairman."
5. Lord Abbett, June 2026 FOMC analysis; Bondsavvy, "June 2026 Dot Plot: What It Means for Money Market Yields."
6. U.S. Bureau of Labor Statistics, Consumer Price Index news release, April 2026; U.S. Bureau of Economic Analysis, Personal Income and Outlays, April 2026; U.S. Bank, "Fed holds rates steady as new Chair Kevin Warsh commits to price stability."
7. Britannica, "2026 Iran war"; Wikipedia, "2026 Iran war."
8. House of Commons Library, "Israel/US-Iran conflict 2026: Reopening the Strait of Hormuz"; Congressional Research Service, R45281.
9. CNBC, "Oil prices turn lower as U.S.-Iran ceasefire extension awaits Trump approval," May 28, 2026; CNBC, "Oil drops 20% from 2026 peak," May 29, 2026; House of Commons Library, op. cit.
10. NBC News, "Iran war ceasefire sends oil prices tumbling and stocks soaring," April 9, 2026.
11. CBS News, "U.S. strikes targets in Iran after Iranian drone attack on cargo ship," June 26, 2026; Al Jazeera, "US launches second night of strikes on Iran after ship hit by drone," June 27, 2026; NPR, "U.S. strikes multiple targets in Iran in response to tanker attack," June 27, 2026; CNN, "US launches more strikes on Iranian sites," June 27, 2026.
12. LPL Research and Hartford Funds historical analyses, as summarized in Focus Partners Wealth, "Geopolitical Conflict and Markets: A Brief History Lesson"; J.P. Morgan Wealth Management, "Crisis in the Middle East: Assessing Potential Market Impacts," jpmorgan.com; Seeking Alpha, "Since 1953 This Is How The S&P 500 Has Performed After A Major Geopolitical Shock," April 2026.
13. International Energy Agency, as cited in Wikipedia, "Economic impact of the 2026 Iran war."
14. Glean, Work AI Index 2026, as discussed by Rebecca Hinds on The Cognitive Revolution; summarized in Biggo Finance, "Rebecca Hinds on the 13-Hour AI Lie."
15. Ibid.
16. Fortune, "The AI economy could crash on mounting chip costs," May 30, 2026.
17. Bloomberg, "AI Circular Deals: How Microsoft, OpenAI and Nvidia Keep Paying Each Other," March 11, 2026; Wikipedia, "AI bubble."
18. CraftedCharts, "AI Circular Financing: Nvidia, Microsoft & OpenAI"; Noah Smith, "Should we worry about AI's circular deals?"; Global Finance Magazine, "AI's Financial Circle Game."
19. Noah Smith, op. cit.; Global Finance Magazine, op. cit.
20. Wikipedia, "AI bubble"; Global Finance Magazine, op. cit.
21.Investing.com, "2026: Another Year of AI Bubble Not Bursting?"; Fortune, op. cit.
22. U.S. Bureau of Labor Statistics, "Consumer prices up 9.1 percent over the year ended June 2022, largest increase in 40 years," The Economics Daily, July 13, 2022, bls.gov.
Disclosures
Fiduciary Financial Advisors does not accept any liability for the use of the information discussed. Consult with a qualified financial, legal, or tax professional prior to taking any action. Before investing, consider investment objectives, risks, fees, and expenses. Investments in securities involve the risk of loss, including loss of principal. Past performance is no guarantee of future returns. The views and opinions reflected in the content are subject to change at any time without notice. The content speaks only as of the date indicated. Some information was obtained from external sources. The information is believed to be accurate, but there is no guarantee that it is.
This commentary is for informational purposes only and does not constitute investment, tax, or legal advice. The views expressed reflect current conditions and are subject to change without notice.
Fiduciary Financial Advisors is a Registered Investment Adviser. Past performance is not indicative of future results, and there is no guarantee that any forecast or projection discussed will come to pass. Third-party data referenced above has not been independently verified by Fiduciary Financial Advisors.
CFP® and Certified Financial Planner® are certification marks owned by the Certified Financial Planner Board of Standards, Inc., and are awarded to individuals who meet its education, examination, experience, and ethics requirements.

86% of California State Employees Are Handling Their Finances Alone.
A CSEA survey of nearly 5,000 California state employees found that 86% handle their own financial and retirement planning, relying on friends, family, and online resources. Here's the confidence gap between DIY planners and those who work with an advisor, and the CalPERS-specific decisions (pension timing, Savings Plus, Social Security, and tax planning) where going it alone may cost you.
Here’s What They May Be Missing.

If you work for the State of California, SMUD, Caltrans, CDCR, or any other CalPERS-covered employer, you have access to a strong retirement benefit package. A defined benefit pension, Savings Plus 401(k) and 457(b) options, and (depending on your role) Social Security coordination that often requires careful planning.
And yet, according to a recent financial preparedness survey of nearly 5,000 California state employees, the overwhelming majority of you are navigating all of that on your own.[1]
That’s not a judgment. It’s a data point. And it’s worth understanding why it matters.
What the Research Actually Says
The 2024 California State Employees Financial Preparedness Report, published by the California State Employees Association (CSEA) and based on a survey of active and retired state workers, found some numbers that are hard to ignore:[1]
86% of California state employees handle their own financial and retirement planning, relying on friends, family, and online resources rather than a professional advisor.
Only 14% use a professional financial advisor, compared to roughly 25% of Americans nationally.
When researchers asked why, the answers were familiar: it costs too much, I don’t have enough saved, I haven’t found someone I trust, or I just don’t think I need one.[1]
Those are all reasonable-sounding explanations. But here’s where the data gets interesting, because the same survey measured how those two groups actually feel about their financial lives.
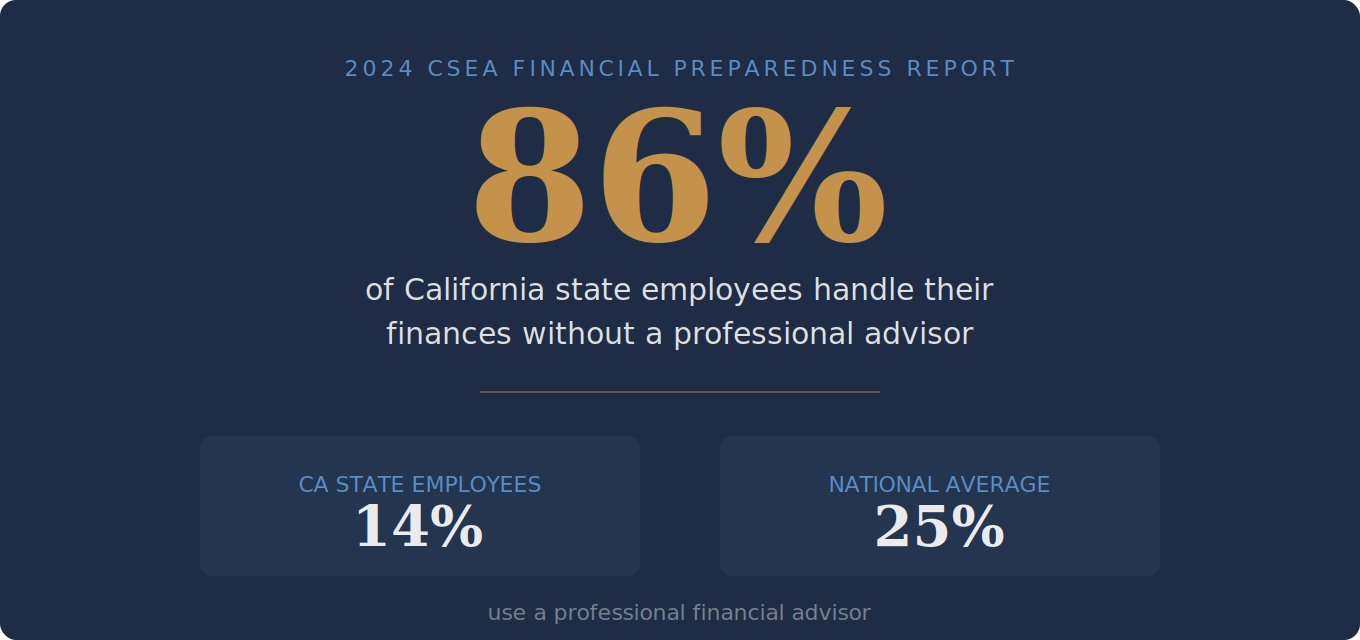
The Confidence Gap You Can Measure
State employees with an advisor: 67% felt confident in their financial decision-making. State employees without an advisor: 39%.
State employees with an advisor: 53% said they were on track or ahead of schedule for retirement. State employees without an advisor: 27%.
That’s not a marginal difference. That’s roughly double the confidence and nearly double the retirement readiness, at least as self-reported.[2]
Now, correlation is not causation (people who seek out advisors may already be more financially engaged). But the gap is wide enough to raise a question worth sitting with: if you’re in the 86% handling your finances without professional guidance, what are the odds there are opportunities you haven’t fully considered?
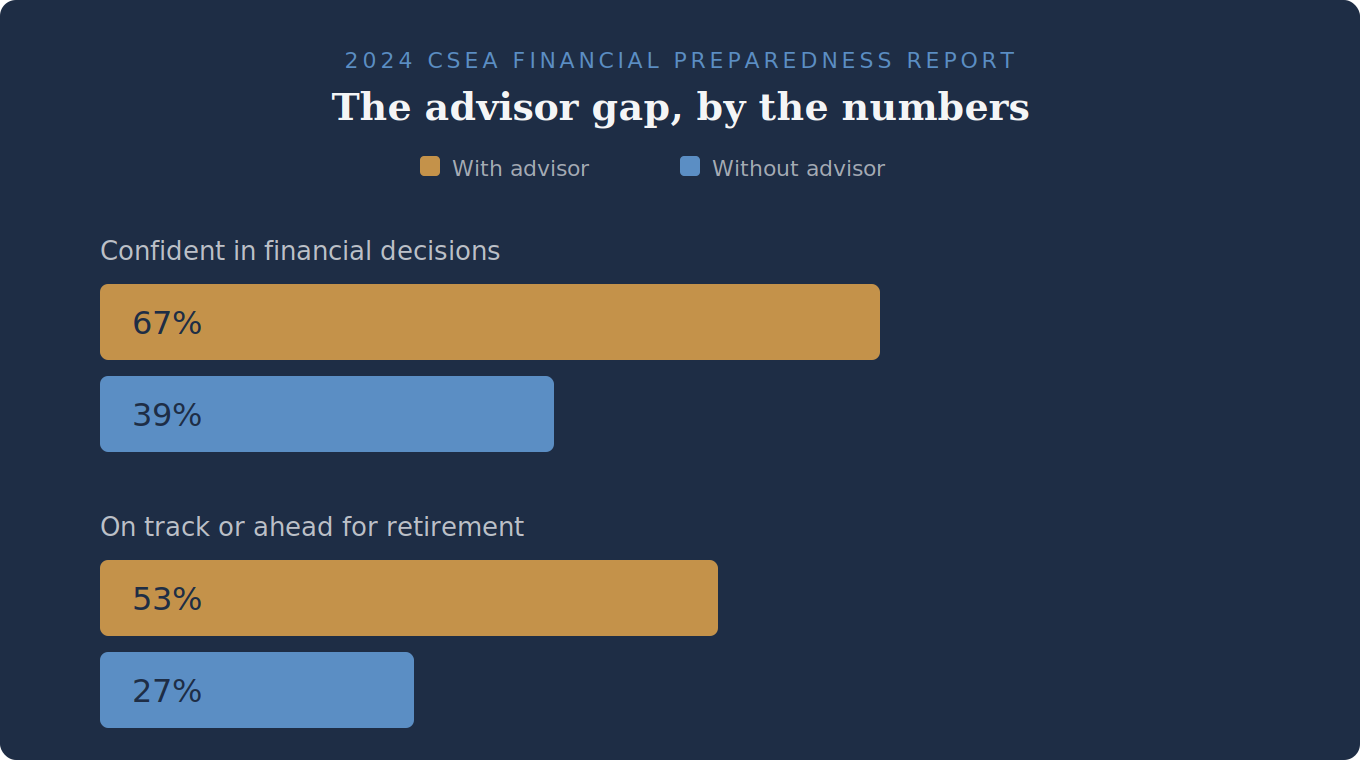
What DIY Planning May Miss for CalPERS Employees
The reason this matters more for public employees than, say, someone with a basic 401(k) and no pension is that your benefits stack is notably complex. There are moving parts that interact with each other, and because some of those decisions (like your pension option election or retirement date) are difficult or impossible to undo, the cost of a misstep may compound over time.
Here are some of the areas where a qualified advisor tends to help clarify the picture for CalPERS members:
Pension Timing and Retirement Date Optimization
Your CalPERS benefit is calculated using a formula, and the timing of when you retire may significantly affect your monthly benefit for life. Retiring right before versus right after a birthday quarter, for example, may change your benefit factor. Many employees look at their pension estimate and assume that’s the number, without realizing that a few strategic adjustments to timing could increase their monthly income (or overlook the impact that a prior divorce may have if the pension benefit was part of the settlement).
And the stakes here differ depending on when you were hired. If you started with a CalPERS-covered employer before January 1, 2013, you’re a “Classic” member with a generally more generous benefit formula, and your final compensation is based on your highest 12 consecutive months of pay. If you were hired on or after that date, you fall under PEPRA (the Public Employees’ Pension Reform Act), which uses a generally less generous formula, a 36-month final compensation period, and a cap on the salary that counts toward your pension. (For simplicity, this overview focuses on miscellaneous members. Safety members and State Second Tier members have different formulas and benefit structures.)[3]
That’s a significant difference. A Classic member nearing retirement may have a richer benefit, but that also means more complex optimization decisions around timing, final comp windows, and retirement option elections. A PEPRA member, on the other hand, is generally working with a less generous formula, which may make supplemental savings strategy and tax planning that much more important for closing the gap between their pension income and the retirement lifestyle they want. Either way, understanding which set of rules applies to you (and how to work within them) is one of the areas where professional guidance may be worth exploring.
Savings Plus Strategy (the 401(k)/457(b) Decision)
If you’re a state employee, you have access to both a 401(k) and a 457(b) through Savings Plus, which means you may be able to contribute up to $49,000 per year in 2026 (or more if you’re over 50 or nearing retirement and eligible for catch-up provisions).[4] But many employees may not be maximizing both plans, and may not be thinking strategically about whether to use pre-tax, Roth, or a combination. The right answer depends on your current tax bracket, your expected pension income, your other sources of retirement income, and your timeline. This is especially true for PEPRA members, whose pension formula and pensionable pay cap may make supplemental savings through Savings Plus an important lever for building retirement security.
And if you work for an employer like SMUD that offers its deferred compensation through Fidelity rather than the Savings Plus/Nationwide platform, the investment options and fee structures are different, which may matter for how you allocate.
Social Security Coordination
Not every CalPERS member pays into Social Security (it depends on your employer’s specific arrangement).[5] For those who do, coordinating your pension income, Savings Plus distributions, and Social Security claiming strategy may noticeably affect your total after-tax retirement income. For those who don’t, understanding how that gap affects your overall plan may be just as important.
Tax Planning Around Retirement
Your CalPERS pension is fully taxable as ordinary income. So are distributions from your Savings Plus accounts (unless they’re Roth). If you’re retiring in California, where state income tax rates may run above 9% for many retirees, the difference between a tax-aware withdrawal strategy and just taking money as you need it may be larger than you’d think.
This is where Roth conversion planning in the years leading up to retirement tends to be especially valuable, and where DIY planners may not realize what options are available to them.
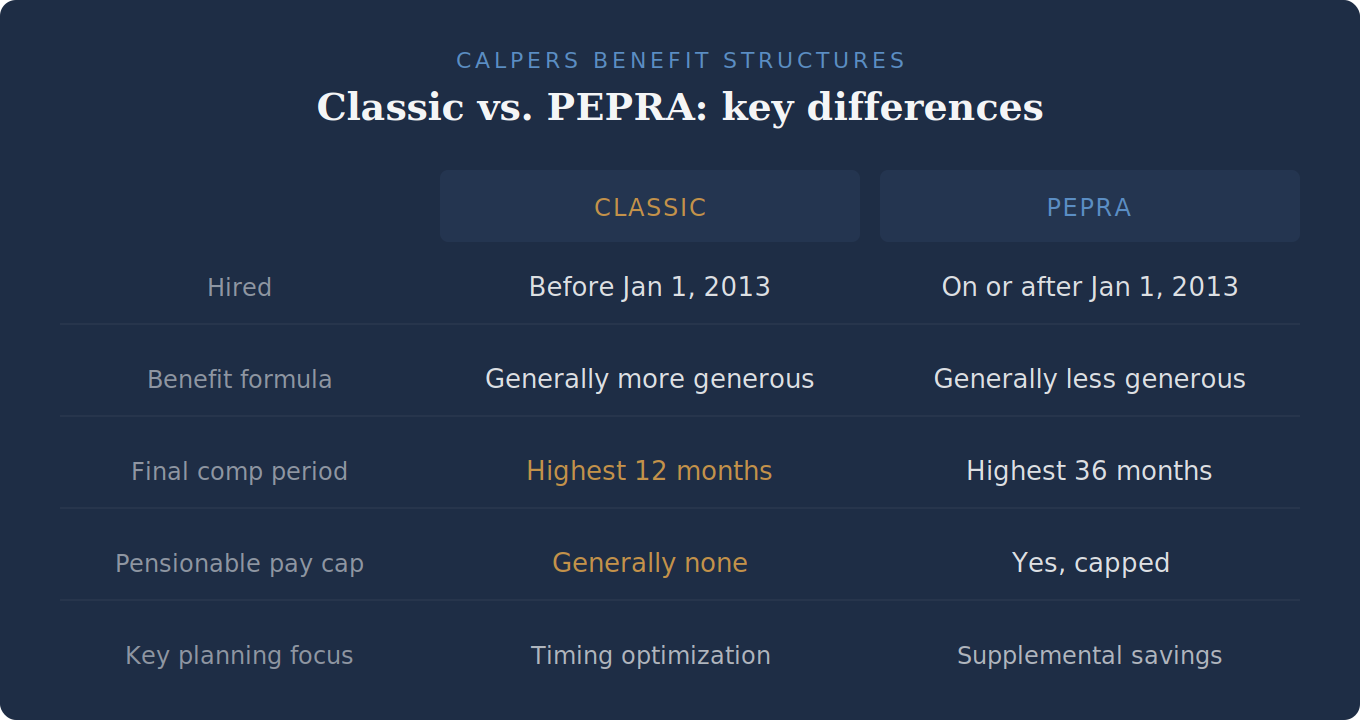
Why Most People Put This Off
(Even When They Know Better)
If you’ve been meaning to get your financial plan together "someday," you’re in very large company. Financial procrastination isn’t laziness. It’s usually one of a few predictable things:
The complexity feels overwhelming. CalPERS alone has multiple benefit formulas, PEPRA vs. Classic distinctions, reciprocity rules, and different employer contracts. Add in Savings Plus, Social Security, tax planning, and retirement timing decisions, and it’s understandable that many people just default to "I’ll figure it out later."
There’s no forcing function until retirement is close. Unlike a leaky roof or a check engine light, the consequences of not having a plan often don’t show up right away. But by the time they do (often in the form of a tax surprise, a suboptimal pension election, or a realization that you can’t retire when you planned), the window to fix things has narrowed.
Trust is a real barrier. The CSEA survey confirmed this.[1] Many state employees haven’t found an advisor they trust, and that’s an understandable concern. Not every advisor understands CalPERS benefits, Savings Plus options, or the specific planning challenges that come with public sector employment. Working with someone who doesn’t know your benefits package well can sometimes feel worse than doing it yourself.
What to Look for If You’re Considering Working with Someone
If you’re a CalPERS member who’s been thinking about getting professional guidance (even if you’ve been thinking about it for a while), here are a few things that tend to matter most:
Fiduciary standard. Look for an advisor who is legally required to act in your best interest, sometimes referred to as a fiduciary. That’s an important distinction worth understanding when evaluating any advisor relationship.
Familiarity with public sector employees and pension benefits. There’s a difference between a generalist financial planner and one who has experience working with pension benefits and public sector employees. Ask whether they’ve worked through pension optimization, deferred compensation strategy, and retirement tax planning with people whose benefits look like yours. Ask how many clients they serve in similar situations.
A comprehensive approach, not just one piece of the puzzle. A good financial plan for a CalPERS member doesn’t stop at a retirement projection. It connects your pension, your supplemental savings, your tax situation, and your investment strategy into a coordinated approach. Look for someone who ties these pieces together rather than addressing them in isolation.
The Bottom Line
You’ve built a career in public service, and the benefits you’ve earned along the way are valuable. But they’re also complex, and the gap between a good plan and no plan may be wider than you’d expect over the course of a retirement.
If you’re one of the 86% who’s been going it alone, that doesn’t mean you’ve been doing it wrong. It might just mean you haven’t found the right fit yet.
Interested in talking through your CalPERS benefits and how they fit into your bigger financial picture? You can schedule a no-obligation introductory conversation below.
Sources
California State Employees Association (CSEA). “2024 California State Employees Financial Preparedness Report.” Published 2024. Survey of nearly 5,000 active and retired California state employees conducted November 2023. N=3,817 active employees (95% confidence, ±2%), N=1,172 retirees (95% confidence, ±2%). Available at cseabenefitsprogram.com.
CSEA. “DIYing Your Own Retirement Savings Plan? Here’s What You Need to Know.” cseabenefitsprogram.com, 2024. National advisor usage estimate (25%) cited from 2022 Harris Poll. Confidence and retirement readiness comparisons derived from the 2024 Financial Preparedness Report.
CalPERS. “Public Employees’ Pension Reform Act (PEPRA).” calpers.ca.gov. PEPRA took effect January 1, 2013, establishing new benefit formulas, final compensation periods, and pensionable compensation caps for members hired on or after that date.
Internal Revenue Service. “401(k) limit increases to $24,500 for 2026; IRA limit increases to $7,500.” irs.gov, November 2025. The 401(k) and governmental 457(b) elective deferral limits are separate, allowing combined contributions of up to $49,000 ($24,500 each) before catch-up provisions.
CalPERS. “Social Security & Your CalPERS Pension.” calpers.ca.gov. Social Security coverage varies by employer arrangement. Non-covered positions (often safety classifications and certain State of California roles) do not withhold Social Security taxes. The Windfall Elimination Provision (WEP) and Government Pension Offset (GPO) were repealed by the Social Security Fairness Act, signed into law January 5, 2025.
Disclosures
This post is for educational purposes only and does not constitute tax, legal, or investment advice. Please consult a qualified financial planner, CPA, and/or attorney before making decisions about your investments.
Investment advisory services are offered through Fiduciary Financial Advisors, a registered investment adviser. This material is for educational and informational purposes only and is not individualized investment, tax, or legal advice. Equity compensation rules are complex and outcomes depend on plan terms, trading windows, holding periods, and individual tax circumstances. Consult your CPA and/or attorney regarding your situation. Any performance shown is historical, for illustrative purposes, and does not indicate future results. Examples are not representative of all securities or outcomes and are not recommendations to buy or sell any security. Data may be obtained from third-party sources believed to be reliable but not independently verified.
Certified Financial Planner Board of Standards, Inc. (CFP Board) owns the CFP® certification mark in the United States, which it authorizes use of by individuals who successfully complete CFP Board’s initial and ongoing certification requirements.

Is the S&P 500 Really All You Need?
"Just buy an S&P 500 fund and chill" or (VOO & Chill) is a popular strategy, but is it really just a concentrated bet on U.S. large-cap stocks? Here's what the lost decade, Japan's 34-year flat market, and decades of research on size and value suggest about using a single index for your entire portfolio.
Why Concentrating Everything in U.S. Large-Cap Stocks Is a Risk Most Investors Are Not Prepared For

If you spend any time in personal finance communities online, you have probably encountered the “VOO & Chill” crowd. The pitch is seductively simple: buy an S&P 500 index fund, hold forever, ignore everything else, and get rich. Why complicate it? The S&P 500 has crushed pretty much everything over the past 15 years. What more evidence do you need?
Quite a bit, actually.
And while we’re at it: this same crowd tends to be loudly, confidently against paying advisory fees. (More on that another time.)
The “just buy the S&P 500” strategy isn’t wrong because index investing is bad. Broadly diversified, low-cost index investing is one of the best things that happened to retail investors in the last 50 years. It’s wrong because it conflates an index fund with the only index you need. Concentrating everything in U.S. large-cap stocks is a real, identifiable risk. And history has handed us the receipts more than once. (Repeatedly. With interest.)
Let’s walk through it.
1. The Story the Last Decade Tells Is Not the Only Story
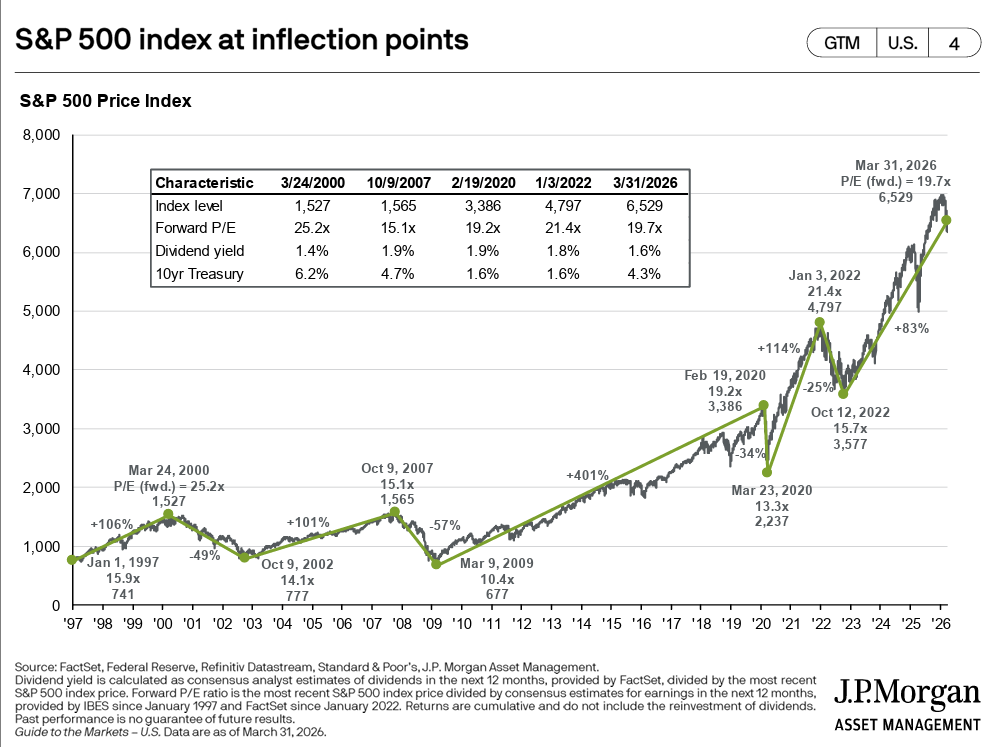
First, a quick vocabulary note. When people say “the S&P 500,” they mean an index of roughly 500 of the largest publicly traded companies in the United States, most of them household names: Apple, Microsoft, Amazon, Nvidia, and so on. When you buy a fund that tracks the S&P 500, you essentially own a small slice of all of them at once. It’s a good idea, as far as it goes. The problem is the “as far as it goes” part.
It’s easy to understand why U.S. large caps look unbeatable right now. The S&P 500 delivered extraordinary returns through the 2010s and into the early 2020s, largely driven by a handful of mega-cap technology companies. If you owned an S&P 500 fund from 2010 to 2024, you were richly rewarded. International markets, emerging markets, small caps, and value stocks all lagged by comparison. It felt obvious: why own anything else?
That kind of thinking has a name: recency bias. It’s the tendency to assume that whatever has worked recently may keep working indefinitely. Think of it like driving while staring in the rearview mirror. The road behind you looked great. That says nothing about what’s ahead. In investing, recency bias tends to be one of the most expensive cognitive shortcuts you can make. (And to be clear, everyone makes it. The question is whether you catch yourself before it costs you.)
The historical record tells a more complicated story. According to Morgan Stanley Investment Management, international stocks have outperformed U.S. markets in four separate decades since World War II: the 1950s, the 1970s, the 1980s, and the 2000s. During those cycles, international stocks beat U.S. returns by a median of roughly 4.9% per year.[1] The current stretch of U.S. dominance is not the rule. It’s the exception. (An unusually long one, which is kind of the point.)
“The four most dangerous words in investing are: this time it’s different.” — Sir John Templeton
2. The Lost Decade: A Preview of What Concentration Can Cost You
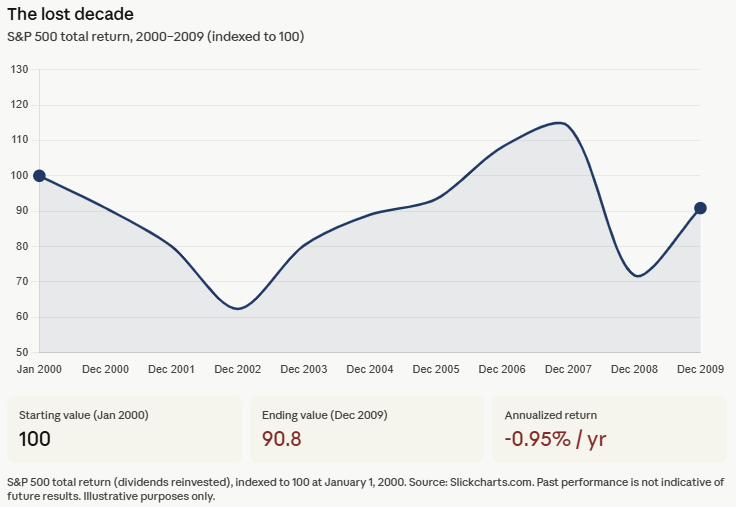
The most recent example of what happens when U.S. large caps hit a wall is the 2000s, a period frequently called the “lost decade” for U.S. investors. The S&P 500 ended 2009 at roughly the same level it started in 2000. Zero price growth across an entire decade. When you factor in inflation, meaning the rising cost of everything around you, investors who went all-in on the index lost real purchasing power over that stretch.
What happened? Two brutal crashes. The dot-com crash starting in 2000 wiped out a wave of massively overvalued technology companies. Then the financial crisis of 2008 hit. The S&P 500 dropped roughly 49% from peak to bottom in the first crash, and roughly 57% in the second. (To put that in perspective: a 49% drop means you need a roughly 98% gain just to get back to where you started. And that’s before the second crash hit.) Investors who had loaded up on U.S. large and mega-cap growth stocks heading into 2000 got hit especially hard, because those were the most overvalued sectors going in. Sound familiar?
Meanwhile, investors who held international developed markets and emerging market stocks fared considerably better. International developed markets outpaced the S&P 500 for much of the decade, and emerging markets, those of countries like Brazil, India, China, and South Korea, performed even more strongly during parts of that period.[2] The diversified investor wasn’t celebrating, but they weren’t devastated either.
This is not ancient history. Anyone who retired in 2000 with a portfolio concentrated in U.S. large caps experienced what’s called sequence-of-returns risk at its most punishing: they were pulling money out of a portfolio that was falling hard in the early years of their retirement, which may permanently affect long-term financial security. And they didn’t get a warning. Nobody does.
3. Japan: The Cautionary Tale That Never Gets Old
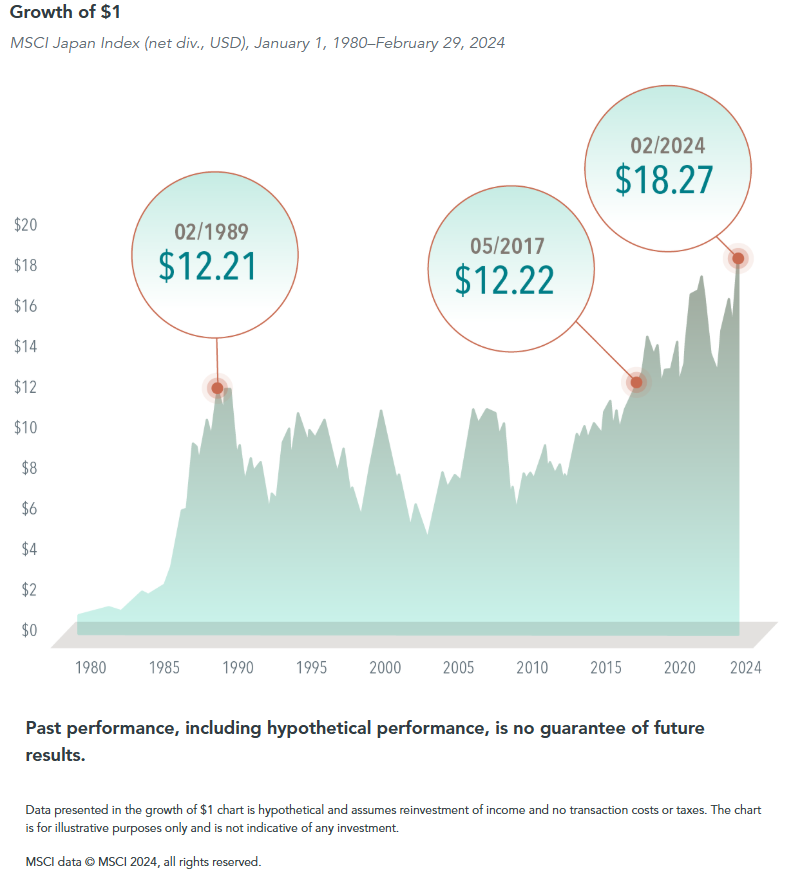
For those who think extreme single-country concentration is only a theoretical concern, I give you Japan.
In the late 1980s, Japan was the investing world’s darling. Its economy had expanded at a remarkable pace for three decades. Japanese companies were buying American landmarks. The Nikkei 225, Japan’s rough equivalent of the S&P 500, gained more than 224% between 1985 and 1989 alone.[3] By late 1989, eight of the world’s top ten companies by market value were Japanese. Tokyo real estate had become so inflated that the grounds of the Imperial Palace were reportedly worth more than all of California. The general feeling, as one writer put it, was that the Japanese economic takeover of the world was inevitable.
You can probably guess where this is going.
The Nikkei peaked at 38,915 on December 29, 1989. It then fell nearly 80% from that peak over the following years and did not recover to that same level until 2024. That’s 34 years.[4] For most of that stretch, a Japanese investor who had put money into the Nikkei earned approximately 1.1% per year, and all of it came from dividends. The price of the index itself was essentially flat for three and a half decades.[5] Entire careers. Entire retirements. Flat.
The valuation context matters here. At the Nikkei’s 1989 peak, investors were paying roughly 60 to 70 times the annual earnings of those companies to own them. The global average at the time was around 15 to 16 times earnings.[6] Japanese stocks were priced at roughly four times what stocks elsewhere in the world cost, relative to what those companies actually earned. (Any of this sounding familiar yet?)
The lesson from Japan is not that this is likely to happen to the U.S. It is that it has happened, that it can happen, and that investors who assumed their home market was permanently exceptional paid an enormous price for that assumption.
4. Current U.S. Valuations Are Not Exactly a Bargain
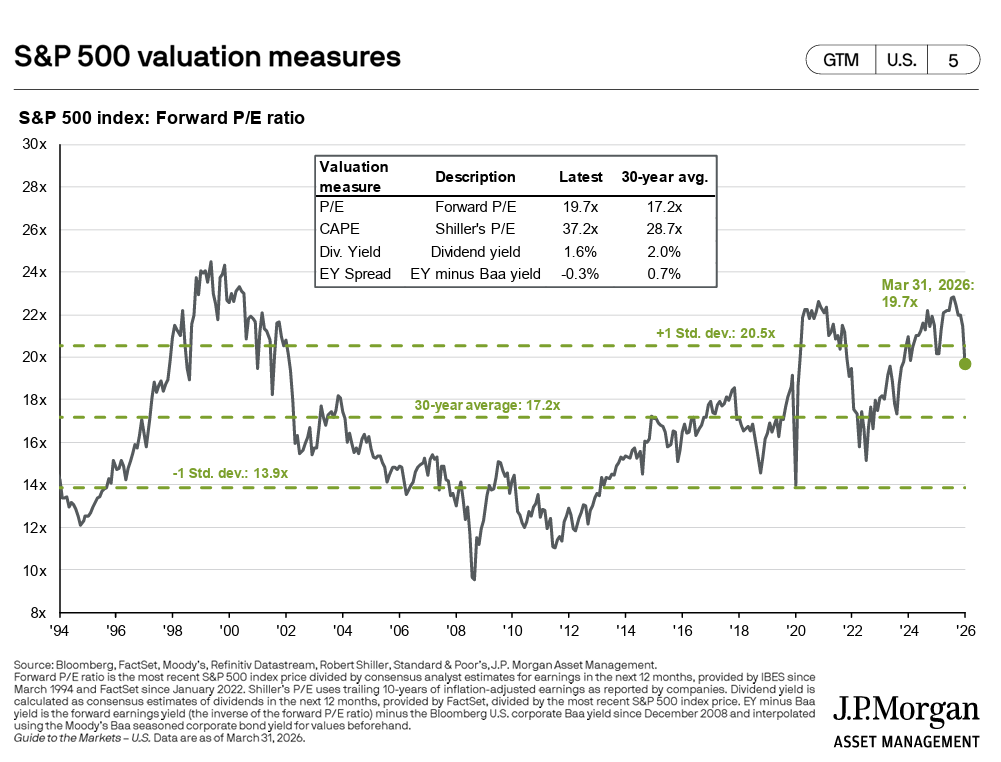
Speaking of how much investors are paying relative to what companies earn.
One of the most widely used long-term valuation measures is something called the Shiller CAPE ratio. (CAPE stands for Cyclically Adjusted Price-to-Earnings. It’s a mouthful, so most people just call it the CAPE.) Instead of just looking at one year of earnings, it averages ten years of inflation-adjusted earnings to smooth out the natural ups and downs of the business cycle. The idea is to get a cleaner read on whether stocks are historically expensive or cheap.
According to J.P. Morgan Asset Management’s Guide to the Markets, as of March 31, 2026, the S&P 500’s Shiller CAPE ratio sits at 37.2x. The 30-year average for that same measure is 28.7x.[7] In other words, by this measure the market is trading at a roughly 30% premium to its own three-decade norm. The forward P/E ratio, which looks at expected earnings over the next twelve months rather than a historical average, sits at 19.7x versus a 30-year average of 17.2x. It currently sits just below the upper one standard deviation band of 20.5x, and was recently above it.7 (That matters: the market has only spent a relatively small portion of the last 30 years above that line.)
To be clear: elevated valuations don’t predict exactly when things may change or by how much. They are notoriously poor short-term timing tools. But research spanning decades of market data suggests that starting valuations are among the stronger predictors of what returns may look like over the next ten years. Higher starting valuations have historically corresponded with more modest returns over the decade that followed.[8] (Not doom and gloom. Just math.)
And by comparison? International developed market stocks were trading at a roughly 40% discount to U.S. stocks at the end of 2024, when you look at the same valuation measures. International small-cap stocks were nearly 30% below their own 20-year average and at an all-time low valuation relative to U.S. large caps. Emerging market stocks sat at a steep discount too.[9] In other words: all of the asset classes that the VOO & Chill crowd tends to skip were, at this particular moment in time, considerably cheaper than what they were choosing to concentrate in. (Worth noting.)
5. You Are Leaving Real Return Drivers on the Table
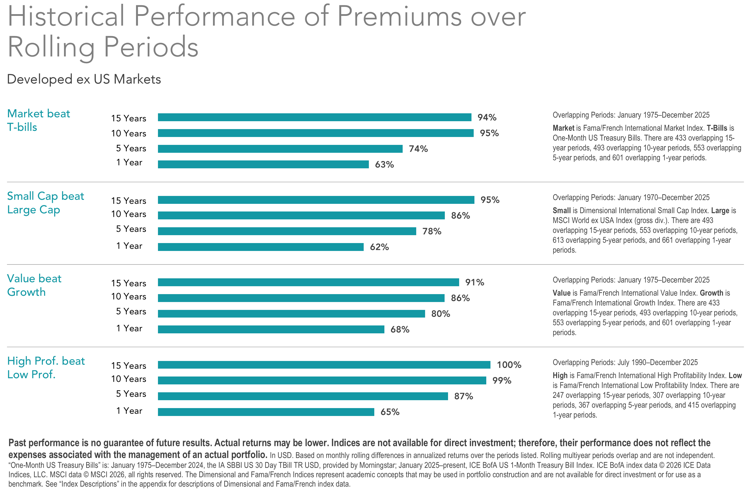
Here’s something that often gets lost in the “just buy the S&P 500” conversation: the S&P 500 is not a neutral, comprehensive exposure to stocks. It’s a specific bet on large and mega-cap U.S. companies, heavily weighted toward technology and growth. By owning only that, you are actively excluding return drivers that decades of academic research suggest are real and persistent.
In 1992, economists Eugene Fama and Kenneth French published research showing that two additional characteristics beyond just “own stocks” explain a large chunk of why some portfolios have outperformed others over time.[10] The first is size: smaller companies have historically outperformed larger ones over long periods. The second is value: companies that are cheap relative to what they actually own or earn have historically outperformed more expensive, high-flying “growth” companies. Later research added a third factor, profitability: companies with strong, durable profits have tended to outperform weaker ones. (Fama won the Nobel Prize in Economics in 2013, partially for this work. It’s not a fringe idea.)
In plain English: history suggests that owning smaller, cheaper, more profitable companies alongside large ones has tended to produce stronger long-term results than owning only the biggest, most expensive ones. The S&P 500 is almost entirely the biggest, most expensive companies in one country. It’s roughly the opposite of what the research points toward.
The size premium, meaning the extra return small-cap stocks have historically delivered over large caps, has averaged roughly 1.5% to 3.5% per year going back to 1926 in U.S. data. The value premium has averaged roughly 3% to 5% per year.[11] These don’t show up every year. But over decades, they tend to compound. Ignoring them entirely isn’t a neutral choice. It’s a bet against them.
Dimensional Fund Advisors has built its entire investment approach around systematically tilting toward these kinds of companies, while staying broadly diversified. Over the 20 years ending December 31, 2022, more than 92% of their funds outperformed their benchmark indexes, compared to roughly 30% of the broader fund industry.[12] That difference is not a coincidence.
The investor concentrated entirely in U.S. large caps isn’t just ignoring other countries. They’re actively betting against decades of research by concentrating in the largest, most expensive companies in one market. (And the fee savings from skipping an advisor to get there don’t exactly cover that tradeoff.)
6. You Cannot Rebalance What You Do Not Have
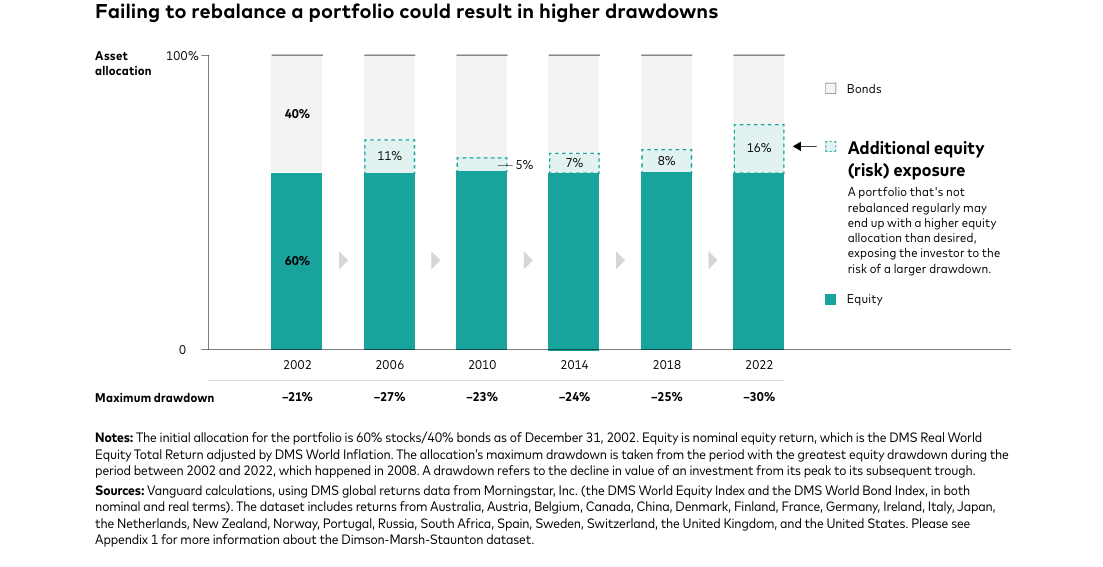
One of the underrated advantages of holding multiple asset classes is what diversification lets you do during volatile markets: rebalance.
Rebalancing just means periodically trimming the parts of your portfolio that have grown and adding to the parts that have fallen. If your international stocks drop 20% while your U.S. stocks hold steady, rebalancing means shifting some money from U.S. stocks into international, buying more of what got cheaper. It sounds obvious. In practice, it’s psychologically brutal because it requires buying the thing that just fell, which feels terrible. That’s exactly why it tends to add value: most people won’t do it.
When international stocks were getting crushed in 2011 and 2012, an investor with a diversified portfolio could systematically shift money toward them at lower prices. When U.S. small caps lagged badly in the early 2000s, the diversified investor was buying them on sale. Both positions eventually recovered and then some.
An investor who only owns an S&P 500 fund has nothing to rebalance into. There’s no other bucket to draw from, and no underperforming asset class to add to at a discount. Every market swing is just a passive ride. You eliminate one of the few systematic, evidence-based advantages available to long-term investors. (And then potentially panic sell at the bottom. Which is its own expensive problem.)
The concept is simple: the less your asset classes move in lockstep with each other, the more rebalancing may benefit you. U.S. stocks, international stocks, small companies, value companies, and emerging markets each tend to respond differently to different economic environments. That’s a feature. Not a bug.
7. The “All You Need” Narrative Already Has Cracks in It
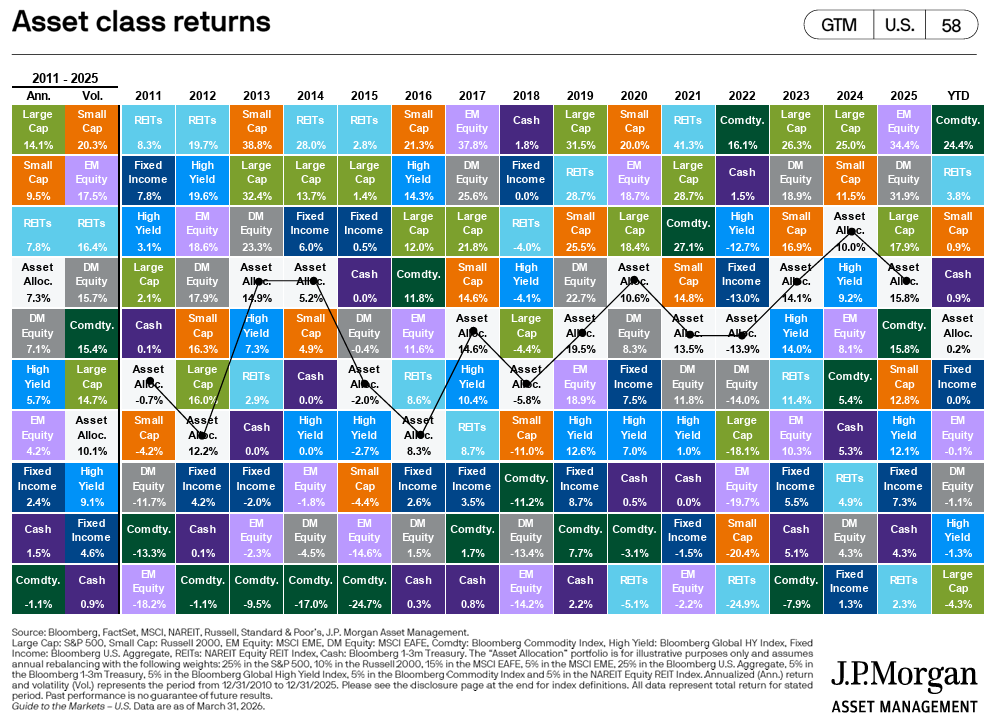
One of the most persistent arguments for the S&P 500-only approach is that it’s simply worked. And for the last 15 years, that’s been largely true. But zoom out even a little, and the narrative starts to look shakier than the Reddit threads suggest.
Take 2025. The S&P 500 had a strong year, finishing with a total return of roughly 18%.[13] A well-diversified portfolio would have owned that. But it also could have owned international small-cap stocks, which finished the year at roughly 33%, and emerging market stocks, those in developing economies like India, Brazil, and parts of Asia, which also finished at roughly 33%.[14] (That’s not a typo.) An investor who only held the S&P 500 captured none of those additional return sources. An investor who held the S&P 500 alongside a broader mix had exposure to all of them.
The point isn’t that one portfolio configuration “won” 2025. It’s that concentrating entirely in the S&P 500 meant leaving additional return sources completely off the table in a year when they happened to perform well. That’s what concentration tends to cost you: not always, not in every year, but sometimes, and often when you least expect it.[15]
The “all you need is an S&P 500 fund” argument tends to rely on a very specific, very recent window of data to make its case. The moment you step outside that window, the argument gets a lot less convincing.
8. Concentration Risk Is Hidden Inside the Index Itself
Here’s a wrinkle that surprises a lot of people: even within the S&P 500, the “500 companies” label is a bit misleading in terms of actual diversification.
The S&P 500 is what’s called a market-cap weighted index. That means the bigger a company is, the more of the index it represents. It’s not 500 equal slices. It’s 500 companies where the largest ones carry a dramatically disproportionate share of the weight. As of 2025, the top ten companies alone accounted for roughly 40% of the entire index.[16] So when you buy an S&P 500 fund, about 40 cents of every dollar you invest is going into just ten companies, most of them in the technology sector.
When Nvidia, Apple, Microsoft, Meta, and a few others are collectively worth as much as the remaining 490 companies combined, you are not holding a diversified basket. You are holding an index that moves largely with the fortunes of a very small number of businesses in a single sector. (You can own all 500 companies and still be highly concentrated. That’s a feature of market-cap weighting that doesn’t get nearly enough attention.)
That concentration inside the index compounds the concentration risk that already comes from ignoring every other type of stock in the world. It’s concentration on concentration.
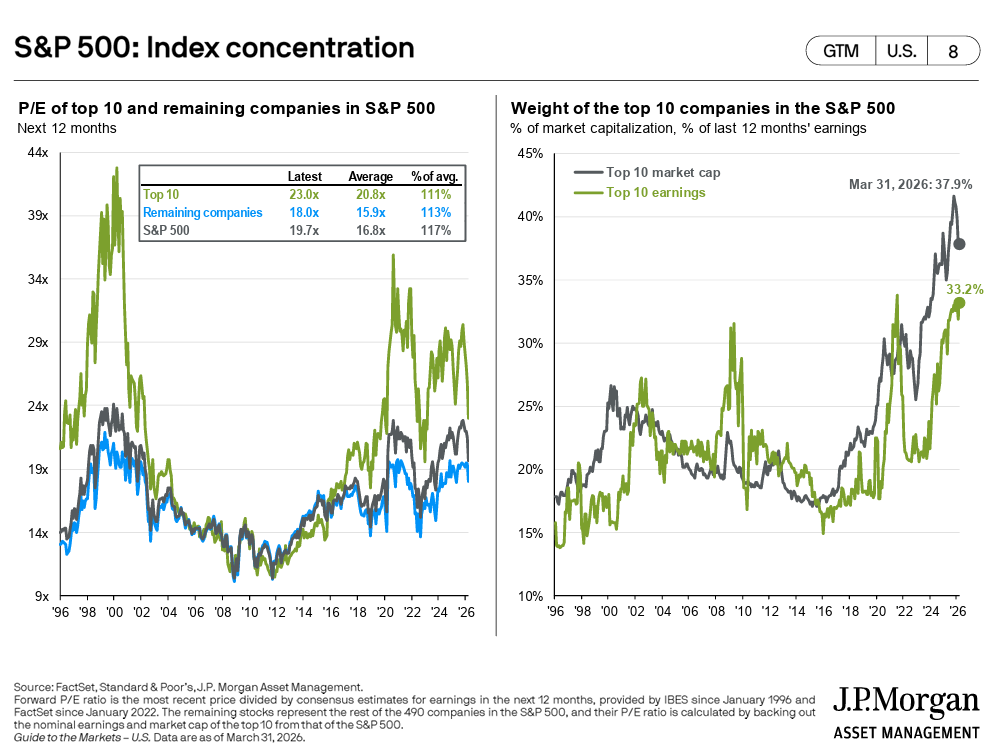
Putting It Together
None of this is an argument against index investing, against owning U.S. stocks, or against the S&P 500 as part of a portfolio. It’s a fine building block. The keyword there is “building block.”
The argument is against treating it as the complete structure.
A thoughtfully diversified portfolio, one that includes exposure to international developed markets, emerging markets, smaller companies, and value-oriented stocks alongside U.S. large caps, isn’t more complicated for its own sake. It’s built to capture multiple return drivers at once, rebalance opportunistically through market cycles, avoid excessive concentration in any single country, sector, or style, and not depend entirely on the continuing outperformance of one corner of one market.
History suggests that exclusive faith in any single market, at any price, is a plan that eventually gets tested. The Japanese investor in 1989 had a decade of evidence that their market only went up. The U.S. dot-com investor in 1999 had years of extraordinary returns that made the strategy feel obvious. The investor concentrating entirely in U.S. large caps today has a similar recent run to point to.
That’s not a track record. That’s a recent stretch of strong performance. And history has a way of eventually testing both.
(And as for the idea that you don’t need an advisor to help you think through any of this: the research on what good financial planning actually delivers doesn’t exactly support the “just buy VOO and skip the fees” thesis. If you’re curious, I wrote about it here.)
Sources
Morgan Stanley Investment Management. “The International Rebalance.” 2024. International stocks have outperformed U.S. markets in four separate decades since WWII — the 1950s, 1970s, 1980s, and 2000s — beating U.S. returns by a median of 4.9% CAGR during those cycles.
Larson Financial Services. “A Diversification Reminder: International Stocks Outperforming U.S. Stocks.” March 2026. From 2000–2009, international developed markets outperformed the S&P 500 by a wide margin; emerging markets performed even more strongly during parts of that stretch.
Wikipedia. “Japanese Asset Price Bubble.” The Nikkei 225 gained more than 224% from January 1985 to its peak on December 29, 1989, closing at 38,915.87.
Wikipedia. “Nikkei 225.” The index hit an intraday post-bubble low of 6,994.90 on October 28, 2008 — approximately 82% below its 1989 peak. It surpassed its 1989 closing high on February 22, 2024, 34 years later.
Money For the Rest of Us. “Japan’s 34-Year Market Underperformance.” Through end of January 2024, the MSCI Japan index returned approximately 1.1% annualized over the full period — all of it from dividends, with essentially zero price return.
A Frugal Doctor. “Japan’s Lost Decades: 30 Years of Negative Returns from the Nikkei 225.” At the Nikkei’s 1989 peak, the P/E ratio was approximately 60x trailing twelve-month earnings vs. a global average of roughly 15–16x.
J.P. Morgan Asset Management. “Guide to the Markets — U.S.” Q2 2026, as of March 31, 2026. S&P 500 valuation measures: Forward P/E 19.7x vs. 30-year average 17.2x; CAPE (Shiller P/E) 37.2x vs. 30-year average 28.7x; +1 standard deviation band 20.5x. Source: Bloomberg, FactSet, Moody’s, Refinitiv Datastream, Robert Shiller, Standard & Poor’s, J.P. Morgan Asset Management.
Invesco / Robert Shiller data. “Applied Philosophy: The Shiller P/E and S&P 500 Returns Revisited.” March 2025. CAPE ratio shows predictive power for 10-year forward returns with R-squared of approximately 0.78 (1983–2015 sample).
Artisan Partners. “International Small Cap: A Strategic Asset Class.” December 2024. At end of 2024, the S&P 500 was 50% above its 20-year average P/E multiple; the MSCI EAFE Small Cap Index was nearly 30% below its 20-year average P/E and at an all-time low valuation vs. U.S. large caps. Emerging markets trading at approximately 40% P/E discount to U.S.
Fama, Eugene F. and Kenneth R. French. “The Cross-Section of Expected Stock Returns.” Journal of Finance, 1992. “Common Risk Factors in the Returns on Stocks and Bonds.” Journal of Financial Economics, 1993.
Ryan O’Connell, CFA. “Fama-French Three-Factor Model: Beyond CAPM.” Size premium (SMB) historically approximately 1.5–3.5% annually in U.S. data since 1926. Value premium (HML) historically approximately 3–5% annually.
Dimensional Fund Advisors. “The Evolution of Small Cap Investing: Four Decades of Innovation.” August 2023. Over the 20 years ending December 31, 2022, 92% of Dimensional’s funds outperformed their prospectus benchmarks vs. approximately 30% industry-wide.
First Trust Advisors / RBC Wealth Management. “The S&P 500 Index 2025 Recap” and “U.S. Equity Returns in 2025.” January 2026. S&P 500 total return (including dividends) for full-year 2025 was approximately 17.9%.
MSCI Index Factsheet. “MSCI Emerging Markets Index (USD).” Full-year 2025 annual return: 33.57%. MSCI ACWI ex-USA Small Cap Value full-year 2025 return: approximately 33.26% (YCharts, as of February 2026).
MFS Investment Management. “International Large-Cap Value: The Forgotten Asset Class.” 2025/2026. The rolling five-year stretch of U.S. outperformance vs. EAFE Value as of December 31, 2024 was the longest in the past 40 years; the degree of relative outperformance had never been witnessed in history in terms of magnitude.
Visual Capitalist / Evaluator Funds. “The U.S. Stock Market vs. Rest of World (1979–2025).” As of 2025, the top 10 companies’ share of the S&P 500 accounted for approximately 40–41% of total index weight.
Disclosures
Fiduciary Financial Advisors does not accept any liability for the use of the information discussed. Consult with a qualified financial, legal, or tax professional prior to taking any action. Before investing, consider investment objectives, risks, fees, and expenses. Investments in securities involve the risk of loss, including loss of principal. Past performance is no guarantee of future returns. The views and opinions reflected in the content are subject to change at any time without notice. The content speaks only as of the date indicated. Some information was obtained from external sources. The information is believed to be accurate, but there is no guarantee that it is.
This content is for educational purposes only and does not constitute personalized tax, legal, or investment advice. Consult a qualified CFP®, CPA, or attorney before taking action.
Fiduciary Financial Advisors is a registered investment adviser. Nothing here constitutes individualized investment advice. Examples are illustrative only and not recommendations. No guarantee of future results. Third-party data is not independently verified.
CFP® and CERTIFIED FINANCIAL PLANNER® are certification marks owned by the CFP Board.

When It’s Okay to Press Pause on Retirement Saving
Financial Planning Isn’t Linear—And That’s Okay
There’s a moment that comes up for many families—not always at the “perfect” time—when life presents a big opportunity that doesn’t neatly fit inside a spreadsheet.
Maybe it’s the chance to buy a home that finally feels right. A better school district. More space. A yard for the kids. A place that feels like yours.
And almost immediately, the question follows:
“Are we being irresponsible if we slow down retirement saving to make this happen?”
Let’s talk about that—honestly, practically, and without guilt.
The Myth of the “Always Max Everything” Plan
In an ideal world, you:
Max out every retirement account
Maintain a perfectly diversified portfolio
Layer in taxable account, HSA, and Roth investments
Maintain interest-bearing liquid savings
And make large purchases without trade-offs
But real life rarely works that way. Resources are usually limited.
Financial planning isn’t about perfection—it’s about prioritization over time.
There are seasons where you may lean heavily into saving and investing in your accounts. And there are seasons where you intentionally redirect cash flow into other investments (a house, life experiences, that family vacation before the kids leave for college, etc.)


Let’s dive into one of the most common pivot points: buying a home.
Imagine a family in their 30s or early 40s:
They’ve been consistently contributing to retirement
They have stable income
They’ve built a foundation
Then a home opportunity comes up:
It requires a larger down payment
It might need a bit of extra TLC or sweat equity
Monthly costs increase
Cash flow tightens
To make it work, they consider reducing 401(k) contributions temporarily, pausing extra brokerage investing, and redirecting savings toward the home.
This isn’t failure.
This is a strategic reallocation.
Pausing or reducing retirement contributions can be reasonable when:
1. You’ve Already Built a Strong Base
You’re not starting from zero
You’ve been contributing consistently
Compounding is already working in your favor
2. The Home Meaningfully Improves Your Life (and/or long-term financial picture)
Stability for your family
Reduced stress or commute
Long-term livability (not a short-term stretch purchase)
3. It’s a Temporary Shift, Not a Permanent One
You have a clear plan to resume contributions
Income is expected to grow or normalize
4. You Avoid Extreme Trade-Offs
You’re not eliminating retirement saving entirely (if possible, still capture employer match)
You maintain some emergency reserves
What You’re Really Doing (Even If It Feels Like a Step Back)
You’re not “falling behind.”
You’re:
Converting liquid investments into home equity
Locking in a fixed housing cost (in many cases)
Creating a non-market-based asset
Investing in lifestyle and stability
If your move involves a new employer, benefits may change more than expected:
Health insurance plans and networks
Retirement plans and vesting schedules
Bonuses, equity, or compensation structure
A pivot point like this is not going to replace the need for retirement planning. But we are so much more than our investment portfolios. We are more than the financial plan. And at the end of our lives, we don’t take what on our balance sheets with us.
There are meaningful ways for us to use income and wealth that bring joy, purpose, and flexibility to our lives now.
However, this is where thoughtful planning matters.
The biggest risk to the success of a financial plan isn’t the temporary pause—it’s poor planning and/or never restarting.
Without a solid plan, “just for now” can quietly turn into:
Losing sight of the long-term plan
Years of under-saving
Missed compounding
A future catch-up scramble

If you’re going to pivot, let’s do it intentionally:
1. Define the Timeline
Put a date on it
2. Keep a Foot in the Game
Even small contributions maintain the habit. Ideally, at least capture the employer match!
3. Build a Restart Plan
Revisit annually (not “someday”). A helpful strategy often lies in increasing contributions with raises or bonuses.
4. Stress-Test the Plan
Let’s run projections with reduced savings. We can be thorough in analyzing the likelihood of meeting your highest priority goals.
A More Helpful Way to Think About It
Instead of asking:
“Am I falling behind on retirement?”
Ask:
“Am I making a thoughtful trade-off that still supports my long-term plan?”
Because good financial planning isn’t rigid—it adapts.
Some of the most successful long-term plans include periods of:
Lower savings
Higher spending
Strategic shifts
What matters is not constant optimization—it’s consistent direction.
A well-timed pivot doesn’t derail a plan.
It reflects one.
Financial plans should evolve with your life, not constrain it
Let’s choose what matters now without losing sight of later.


Recent Articles Written by Kristiana:



Fiduciary Financial Advisors, LLC is a registered investment adviser and does not give legal or tax advice. Information presented is for educational purposes only and does not intend to make an offer or solicitation for the sale or purchase of any securities. The information contained herein has been obtained from a third-party source which is believed to be reliable but is subject to correction for error. Investments involve risk and are not guaranteed. Past performance is not a guarantee or representation of future results.
Fiduciary Financial Advisors does not give legal or tax advice. The information contained does not constitute a solicitation or offer to buy or sell any security and does not purport to be a complete statement of all material facts relating to the strategies and services mentioned.
Your Finances Called. They've Been Waiting (Right Behind That New Year's Resolution)
You already know what you need to do with your money. Set up the account, look at the retirement contributions, make a plan. You've known for a while. This piece looks at why the gap between intention and action is so hard to close, what the research on financial procrastination and present bias actually says, and the one simple thing that tends to move people from "meaning to" into "done."

Let's just say it out loud: you already know what you need to do with your money. You've known for a while. Maybe months. Maybe longer. Get that investment account set up. Actually look at your retirement contributions. Make a plan. Talk to someone. You've thought about it in the shower, during your commute, at 2 a.m. when the ceiling won't stop staring back at you. And yet here you are. Still thinking about it.
You're in excellent company, by the way. A tragically enormous amount of company.
The New Year's Resolution Hall of Shame
How's that working out?

Spoiler: it's not.
Research shows that only 9% of people actually keep their New Year's resolutions throughout the year.[1] Nine. Percent. That means 91 out of every 100 people who made a big, bold declaration on January 1st are quietly abandoning ship. And it doesn't take long: 23% quit within the first week, and 64% have thrown in the towel by the end of the first month.[2] Strava, a fitness tracking app with hundreds of millions of data points, named the second Friday of January "Quitter's Day," because it's the single most popular day for people to give up on their goals.[2]
The second Friday of January. We can't even make it three weeks.
Among those who set resolutions in 2024, 49% said they had abandoned them entirely by the end of February (and let me remind you, it's already April), with 40% having done so in January alone.[3] And here's the kicker: 80% of goal-setters feel completely confident they'll stick to their resolutions throughout the year.[4] The confidence isn't the problem. The follow-through is.
Sound familiar? That's because it's the same story playing out in personal finance, year after year.
The Financial Version Is So Much Worse

Here's where the New Year's resolution problem and the financial inaction problem converge into something genuinely uncomfortable.
According to a CNBC survey, 53% of Americans say they're behind schedule on retirement planning and savings.[5] More than half. (I'll say it again. More than half....) A separate study from Allianz Life found that 64% of Americans worry more about running out of money than they worry about dying.[6] (Turns out the old joke about dying with your last check bouncing isn't so funny when it starts to feel like a real possibility.) And yet, according to a Schwab study, only 36% of Americans have a written financial plan.[7]
People are scared. They know they're behind. And they still aren't doing anything about it.
Meanwhile, 68% of Americans near or in retirement say they will need to delay retirement because they don't have enough saved,[8] and 64% of Americans wish they had started saving before age 25, even though the average starting age is 28.[8] A handful of years doesn't sound like much until you remember the 8th wonder of the world: compound interest. (Now ask yourself: how much longer can you afford to wait?)
And before you say "it's too late for me anyway," no. It's not. You just could have started sooner.
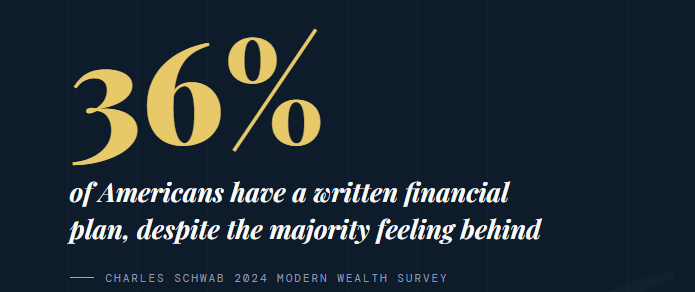
Research on procrastination and personal finance confirms what the data shows: procrastinators are significantly less likely to participate in savings plans, tend to initiate saving later, and are less likely to save a fixed amount every month. Procrastinators are also about nine percentage points less likely to have a will or trust, and report lower retirement satisfaction overall.[10] The delay doesn't just cost money. It costs peace of mind. (Funny enough, I wrote about exactly this. Read it here.)
You're Not Lazy. You're Human. (But Also, Come On.)
Here's what the research actually says about why we don't do the things we know we should do with our money.
Experts define financial procrastination as voluntarily delaying planning or implementing finance-related decisions, despite expecting to be worse off for the delay.[11] One researcher at Carleton University described the core problem this way: "You know what you ought to do and you're not able to bring yourself to do it. It's that gap between intention and action."[12]
That gap? It's enormous. And in personal finance, it can be expensive. (Ah, expensive. Maybe that's the word that finally gets you moving.)
The psychology behind it is called "present bias," which is our brain's tendency to prioritize immediate rewards over future benefits. Saving for retirement thirty years from now doesn't trigger the same urgency as whatever is happening right now. The future version of you who needs that money feels abstract. The discomfort of sitting down and actually dealing with it feels very, very real.[11] (Which is probably why it's easier to replay every financial decision you wish you could take back than to actually sit down and make a plan. That can't just be me.)
Meanwhile, 35% of people cite losing motivation as their top reason for giving up on goals, followed by being too busy (19%) and shifting priorities (18%).[2] Too busy. Too tired. Too overwhelmed. (Time to consider hiring a pro yet??) The reasons are real, and they will always be there. There will never be a perfect window of time when everything clears up, your inbox is empty, and the stars align for you to finally sort out your financial life. Waiting for that window is its own financial strategy. A terrible one. (Which is probably why the IRS has an annual deadline on April 15th... unlike your financial plan.)

"I'll Start When the Market Settles Down": A Love Story
You know what's fascinating about financial procrastination? It never feels like procrastination while you're doing it. We tell ourselves it's prudence. Like waiting for the right moment. Like doing more research first. Like waiting to see what the market does.
There is always a reason to wait. Markets are too volatile. Markets are too calm. The economy is uncertain. Tax laws might change. You don't have enough saved to make it worth starting yet. You're not sure which account to open. You want to understand it better before you commit.
Research confirms that the gap between intention and action grows the further the action is placed in the future.[11] Translation: the longer you wait to deal with your finances, the easier it gets to keep waiting. And each month of delay represents compounding growth potential that has passed. It doesn't come back. (And please don't tell me you're waiting to buy the dip...)
The research also notes that procrastination in financial decisions is essentially irrational behavior: a core characteristic is the realization by the actor that one will be worse off because of the delay, yet the delay happens anyway.[10]
You already know this.
You've probably known it for years.
And yet, still waiting.
Probably still thinking about it.
What Actually Changes Things

Studies show that people who set up a way to be accountable for their financial goals are far more likely to achieve them.[1] Not just more motivated. More likely to actually follow through. (Ahem... funny how that works.)
Accountability. Structure. Someone who can provide perspective, ask relevant questions, and help you evaluate potential next steps.
That's exactly what a consultation is. It's not a commitment to overhaul your entire financial life in one afternoon. It's not signing anything or locking yourself into anything. It's a conversation, a structured one, where you stop spinning in your own head and start actually moving. Where someone helps you figure out what's most important to address first, and what a realistic path forward actually looks like.
Columbia University research shows that while nearly half of Americans make New Year's resolutions, only about 25% stay committed after just 30 days, and fewer than 10% accomplish their goals.[13] (Now contrast that with the 94% of households advised by a CFP® professional who feel confident in their ability to achieve their financial goals.[14] Funny how having a plan and a pro in your corner tends to change things.) The people who do succeed don't have more willpower or more money or more time than you. They have a system. They have support. They stopped trying to figure it all out alone.
So Here's the Part Where I Call You Out (Lovingly)
You've read this far. Which means some part of you is nodding along, maybe a little uncomfortably, thinking yeah, this is me. Good. That recognition is the first step.
The second step is embarrassingly simple: schedule the consultation.
Not "look into it." Not "think about reaching out soon." Not "maybe after things calm down a little." Now, seriously.... While the itch is still there. Because the data is brutally clear: the longer the gap between intention and action (remember that study I just referenced above), the wider it gets, until one day you look up and realize you've been "meaning to get your finances sorted out" for five years, and the compounding you missed doesn't care about your intentions.
You deserve more than five more years of thinking about it. (And realize, I've been trying to reach some of you for almost that long already.)
The hardest part is genuinely just making the appointment. Everything after that? That's what I'm here for.
(This post was lovingly inspired by that tax return that I kept putting off. Which I got to eventually... remember... there's an actual deadline... unlike your financial plan.)
References & Sources
Fisher College of Business, Ohio State University. "Why Most New Year's Resolutions Fail." Lead Read Today. fisher.osu.edu
Inside Out Mastery. "19 Surprising New Year's Resolution Statistics (2024 Updated)." insideoutmastery.com
The Harris Poll, conducted on behalf of Origin Financial, January 13–15, 2025 (n=3,059 U.S. adults). Published by Origin Financial: "The New Year Called – It Wants Its Resolutions Back." useorigin.com
Drive Research. "New Year's Resolutions Statistics and Trends." driveresearch.com
CNBC / SurveyMonkey. "53% of Americans Surveyed Feel They Are Behind on Their Retirement Savings." cnbc.com
Allianz Life Insurance Company of North America. "Americans Are More Worried About Running Out of Money Than Death." 2025 Annual Retirement Study, Allianz Center for the Future of Retirement (January/February 2025, n=1,000). allianzlife.com
Charles Schwab. "2024 Modern Wealth Survey." Conducted by Logica Research, March 2024 (n=1,000). aboutschwab.com
Voya Financial / F&G Annuities. "Facing Delayed Retirement, Many Americans Wish They Had Started Saving Sooner." PLANADVISER. planadviser.com
Ahead App. "Why Procrastination in Retirement Planning Costs You a Comfortable Future." ahead-app.com
Shah, R. & Mukherjee, A. "Procrastination in Personal Finance: Implications for Estate Planning and Retirement Satisfaction." ScienceDirect, 2025. sciencedirect.com
Svartdal, F. et al. "Procrastination and Personal Finances: Exploring the Roles of Planning and Financial Self-Efficacy." Frontiers in Psychology, 2019. frontiersin.org
Pychyl, T. "Why Wait? The Science Behind Procrastination." Association for Psychological Science. psychologicalscience.org
CBS News / Columbia University. "New Year's Resolutions Often Don't Last. Here's Why They Fail." cbsnews.com
CFP Board. "Trust. Confidence. Impact: 2025 Financial Planning Longitudinal Study." cfp.net
Certified Financial Planner Board of Standards, Inc. (CFP Board) owns the CFP® certification mark in the United States, which it authorizes use of by individuals who successfully complete CFP Board's initial and ongoing certification requirements.
Investment advisory services are offered through Fiduciary Financial Advisors, a registered investment adviser. This article is for informational and educational purposes only and should not be construed as personalized investment, tax, or legal advice. Any references to scheduling a consultation are for general informational purposes and do not create an advisory relationship. Third-party research, statistics, and survey data cited are believed to be reliable but have not been independently verified. All data is subject to change. References to CFP® professionals relate to industry research and do not imply that any specific outcome will be achieved.

Future Proof Feature: Jeff Janson
Jeffrey Janson weighs in on the intersection of AI and the wealth management business.
What will the AI revolution mean for clients?
Fiduciary Financial Advisors, LLC is a registered investment adviser. Information presented is for educational purposes only and does not intend to make an offer or solicitation for the sale or purchase of any securities. Investments involve risk and are not guaranteed. Be sure to consult with a qualified financial adviser and/or tax professional before implementing any strategy discussed herein.
Recent Articles Written by Jeffrey:






5 Toxic Financial Myths that Undermine Clinician Happiness
As a healthcare professional, you're used to getting extensive training and making high-stakes decisions. You've dedicated your life to helping others, but are you making sure you’re helping yourself?
It turns out that some of the most common, well-meaning "financial wisdom" out there might be making you less happy. Credit to Morgan Housel’s podcast episode for giving me some ideas for this blog post.
Myth 1: Your Net Worth is Your Self-Worth
We're all taught to keep score in life: grades, clinical hours, jobs, incomes, and eventually, the size of your bank account. We start treating money not as a simple tool to help us achieve our goals but as a scorecard for personal value, insight, or wisdom.
The Scorecard Trap: If you tie your personal value to your net worth, every market dip feels like a personal failure, and every new purchase by a colleague feels like a threat. Money is a tool and should be utilized as such; it is not a mirror that reflects your soul.
Wealth vs. Wisdom: It’s easy to assume that because someone is financially successful (say, they started their own business and are very successful), their opinions on everything else—from parenting to politics—must also be insightful. Be careful who you take universal life advice from. Just because they are successful in one area of their life does not also translate over into all other areas.
Myth 2: The Misery of Chasing Status
In the workplace, we instinctively know where everyone sits in the hierarchy. Unfortunately, this behavior carries over to our financial lives, and it’s a primary driver of modern psychological distress.
Status vs. Independence: Are you buying that huge house, that fancy car, or that country club membership because you genuinely value it, or because you think it will confer status in your social circle? The chase for status often forces you into massive debt, making you less independent and more beholden to your high-paying, high-stress job. That lack of independence is where the misery begins.
Envy's Blind Spot: We only see the headline: the vacation pictures, the promotion, the new piece of medical equipment. We don't see the 80-hour work weeks, the terrible commute, the lack of family time, or the crushing debt it took to get there. Don't envy a picture without knowing the full cost of the frame.
Myth 3: Maximizing Efficiency While Destroying Your Cushion
In healthcare, "maximizing efficiency" is a mantra. But when applied to your personal finances and your life, maximizing efficiency without allowing room for error is a recipe for catastrophic failure.
The Danger of No Cushion: You can optimize your finances down to the penny, but when the inevitable "speed bump" arrives. A sudden disability, a lawsuit, a burnout-induced job change; you have nothing to absorb the shock. You need to intentionally live below your potential to build a financial and emotional cushion for unforeseen risks.
Burning Bridges for 'Efficiency': You know that a well-functioning OR or clinic depends on relationships, not just checklists. When you apply the 'maximization' mindset to people, viewing every interaction as a transaction that must provide immediate, measurable value, you burn bridges. Investing in relationships is the opposite of efficiency, but it’s one of the most powerful career and life tools to invest in.
Myth 4: The Addiction to the Dopamine Hit
Remember the first time you got a big paycheck or finally paid off that huge student loan chunk? That initial "buzz" is amazing. The mistake is believing that the feeling will keep happening.
The False Indicator of Joy: We often assume the initial excitement (that dopamine hit) we get from a new activity, like making money in a new stock, is a good indication of long-term joy. It’s not. The problem is that we chase that newness, that buzz, hoping to recreate the initial feeling. You cannot. Long-term happiness comes from quiet satisfaction and purpose, not fleeting excitement.
Valuing Appearance Over Productivity: Do you find yourself sitting at your desk, furiously typing emails just to look busy? In a high-stress role, sometimes the most productive day is the one you spend sitting quietly, thinking, charting a course, or even taking a well-deserved mental health break. Don't fall for the trap of valuing the appearance of being busy over actual productivity.
Myth 5: Defending Old Beliefs Over Learning
You finished years of intense training, passed all your boards, and now you’re an expert. Done, right? Wrong. The world is always changing, and stopping your intellectual growth limits your insight.
The Age 22 Defense: Don't spend the rest of your life defending what you learned by age 22 (or age 32, for that matter). The best financial minds are constantly reading, engaging in thoughtful debates, and challenging their own assumptions. Proactively continuing to learn is the only way to avoid becoming intellectually rigid.
The Conversation Competition: Social media has turned every topic into a "my team versus yours" battle for social hierarchy. Don't view every conversation about money or investing as a competition to "win." The goal isn't to be right; the goal is to get smarter and find the truth, even if it hurts your existing position.
Your career is about making smart, informed decisions to improve the lives of others. Your personal finance strategy should be too. If you feel like your "success" isn't bringing you the happiness it promised, chances are you’ve fallen for one of these five common traps.
The good news? You can pivot. Start treating money as the tool it is, prioritize independence over status, and build your cushion, both financial and emotional, into your life.
Want to re-evaluate your current financial strategy to ensure it's built for your long-term happiness, not just your net worth? As a financial planner who specializes in working with busy healthcare professionals: Physicians, Apps, and Nurses, I help clients align their money with their actual life goals.
It's time to chart a financial course that prioritizes your peace of mind, the ultimate return on investment.






Fiduciary Financial Advisors, LLC is a registered investment adviser and does not give legal or tax advice. Information presented is for educational purposes only and does not intend to make an offer or solicitation for the sale or purchase of any securities. The information contained herein has been obtained from a third-party source which is believed to be reliable but is subject to correction for error. Investments involve risk and are not guaranteed. Past performance is not a guarantee or representation of future results.
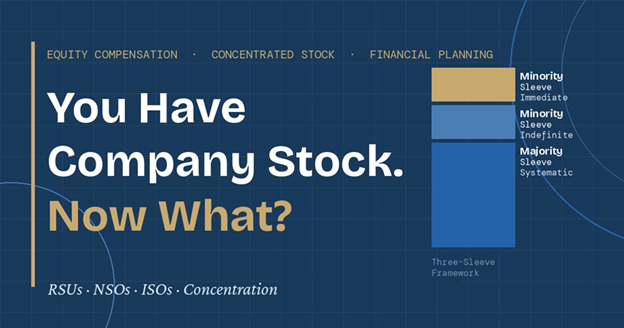
You Have Company Stock. Now What?
RSUs vesting every year, stock options you've been meaning to deal with, and a nagging sense you're overdue for a plan. The hard part usually isn't understanding the rules; it's follow-through, since there's always a reason to wait one more quarter. This piece covers how RSUs, NSOs, ISOs, and PSUs are taxed, why a concentrated position is riskier than it feels, and a three-sleeve framework for reducing it on a schedule you set in advance.
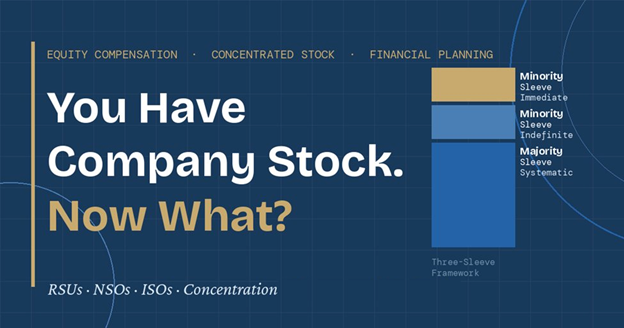
RSUs, stock options, and why the thing stopping most people isn’t knowledge. It’s inertia.
If you have RSUs vesting every quarter and stock options you’ve been meaning to deal with, you’re probably overdue for a plan. (You probably know that already).
This post covers the key tax rules, a three-part framework for deciding what to do with a concentrated position, and the one thing that stops most people from following through even when they know exactly what they should be doing.
The framework works whether your concentration came from equity comp, stock purchases, or inheritance. And it’s worth noting upfront: equity is rarely the only moving piece in someone’s financial life. A plan that accounts for all aspects of your finances is likely to result in a better outcome than one that treats the stock in isolation.
The Tax Rules, Without the Jargon (OK, Maybe There Is Some Jargon After All)
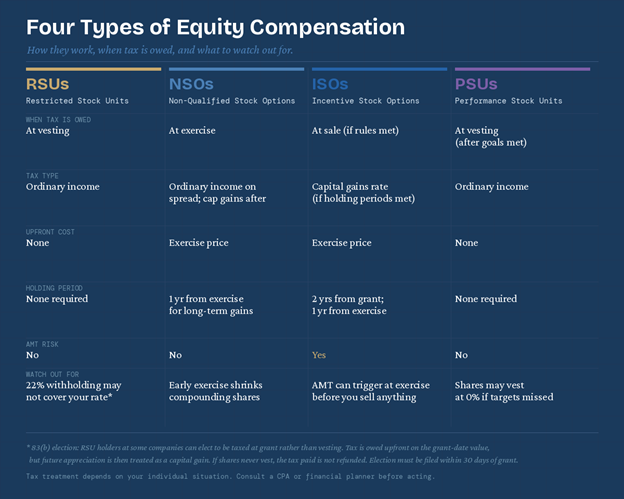
Figure 1: RSUs, NSOs, ISOs, and PSUs side by side. When tax is owed, what type of tax applies, and what to watch out for.
When RSUs vest, income tax is triggered on whatever they’re worth on that day, whether you sell them or not. So, holding onto vested RSUs is less of a tax move than a choice to keep owning your company’s stock (you will be taxed at either short-term or long-term capital gains rates on the growth after they vest). It’s also common practice for employers to withhold federal taxes at 22% when RSUs vest. Depending on your situation, your actual rate may differ, so it’s worth planning ahead and making sure you have the cash set aside for your tax bill if you are in a higher tax bracket. [1,2,3]
NSOs work differently, and there are two separate tax events to keep track of. The first happens when you exercise: the difference between your exercise price and the current market value of the shares gets taxed as ordinary income right then, regardless of whether you sell. The second happens when you eventually sell: any additional gain from that point forward is a capital gain. If you sell within a year of exercising, that gain is taxed as a short-term capital gain at your ordinary income rate. Hold for more than a year before selling, and it qualifies as a long-term capital gain, which may carry a lower rate than ordinary income, though that depends on your income level and overall tax situation. The key thing to understand is that these are two distinct events with two different tax treatments, and they don’t offset each other. [1]
ISOs can get you better tax treatment: if you hold the shares for at least two years from the grant date and one year from when you exercised, your gains typically get taxed at the lower capital gains rate instead of as regular income. Two things to watch out for, though. First, exercising ISOs can potentially trigger AMT, a parallel tax calculation that could create a bill even before you’ve sold anything. Second, there’s a $100,000 annual cap on ISOs, and anything above that is treated like an NSO. The tax benefit is real, but so is the risk. If the stock drops before you hit the holding period, you can lose actual money even while technically qualifying for the favorable rate. The right call depends on how much risk you’re comfortable taking with the holding period you choose. [4,5]
Why Concentration Is Riskier Than It Feels
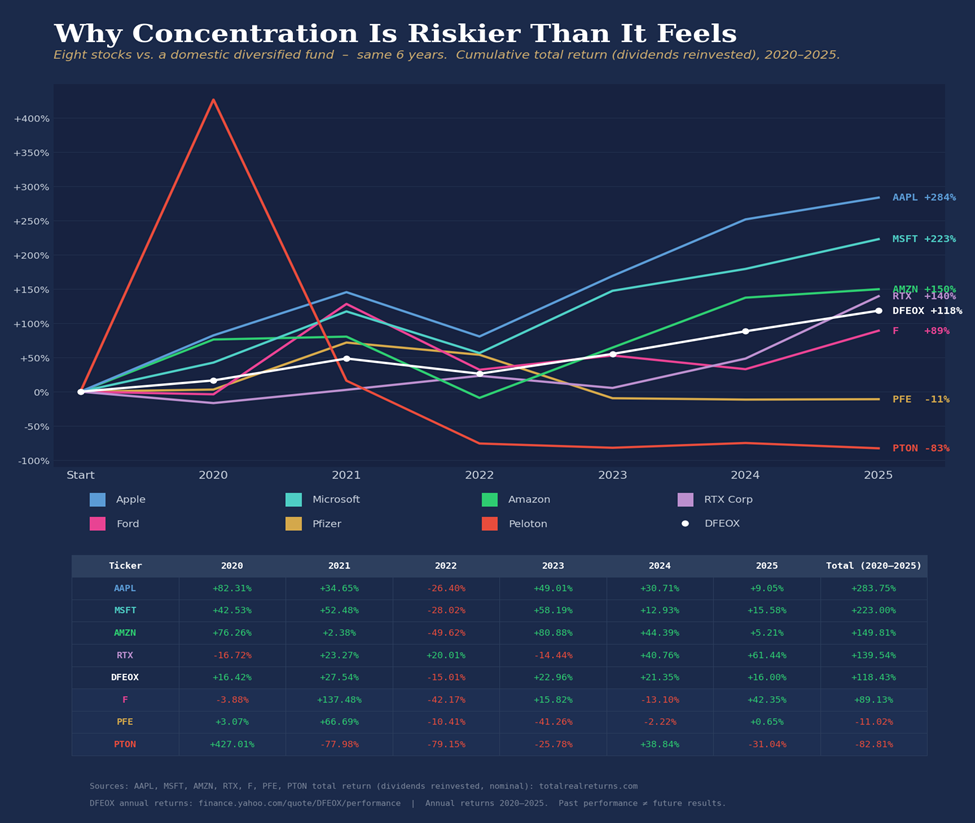
Figure 2: Eight stocks compared to DFEOX - DFA U.S. Core Equity 1 Fund (~2,700 stocks). Same six years, 2020-2025, cumulative total return with dividends reinvested. AAPL: +284%; MSFT: +223%; AMZN: +150%; RTX: +140%; DFEOX: +118%; Ford: +89%; PFE: -11%; PTON: -83%. Sources: totalrealreturns.com (AAPL, MSFT, AMZN, RTX, F, PFE, PTON); finance.yahoo.com (DFEOX)
This illustration uses a limited set of widely recognized companies for educational purposes and is not representative of all outcomes. The securities shown were selected solely as examples; this is not a recommendation. Performance shown is historical and does not indicate future results.
Harry Markowitz published his groundbreaking paper in 1952, showing that diversification can reduce risk for a given level of expected return, compared with concentrating in a single investment. (He won the Nobel Prize in Economics in 1990 for the work.) Not exactly a hot take at this point, but worth understanding why. When you own a single stock, you carry the risk that’s specific to that company: a bad earnings quarter, a leadership change, a regulatory problem, PR issues, whatever. That’s sometimes referred to as uncompensated risk, meaning you’re potentially taking on extra volatility that isn’t necessarily rewarded with higher expected returns. Spreading across many stocks reduces that layer, because when one company hits a rough patch, others don’t necessarily follow. If you’ve generated meaningful wealth from a concentrated position, it may be worth taking some risk off the table and diversifying, rather than letting it all ride. [6]
What the chart shows is that outcomes would have varied depending on which stock you happened to hold (if you held one of them). Apple and Microsoft both ended up towards the top over the full period, but each fell roughly 26-28% in 2022, which means even the highest performers in the period had rough patches. RTX also outpaced the fund (eventually). Amazon performed a little better, but with a bumpier ride. Peloton (which was up over 400% at its peak in 2020) collapsed to an 82% cumulative loss by 2025. Ford spiked +137% in 2021 on EV optimism, then gave back most of it the following year, and eventually trailed the fund over the full six years. Pfizer surged +67% in 2021 on vaccine demand, then spent the next four years in decline, ending with a negative total return including dividends. (If you want to see more cautionary tales of volatility from brands you probably recognize, just go look up AMC, Boeing, Bed Bath & Beyond, Anheiser Busch, etc….)
DFEOX (a fund with ~2,700 stocks) returned +118% over the same period. Not the best outcome on this list, but not the worst by a long shot, either, and without the same level of risk that is carried when holding a single company. That’s the core of what diversification actually does: it doesn’t guarantee the best return, but it can reduce the impact of extreme single-company outcomes.
Now, keep in mind that when you are looking at this graphic, the intent is to show you a range of outcomes from familiar companies (many of which issue equity compensation).
Research suggests over 100 distinct ways advisors add value across planning domains.¹³ Effective advisors go deep on services most relevant to their clients' needs.
The Three-Sleeve Framework
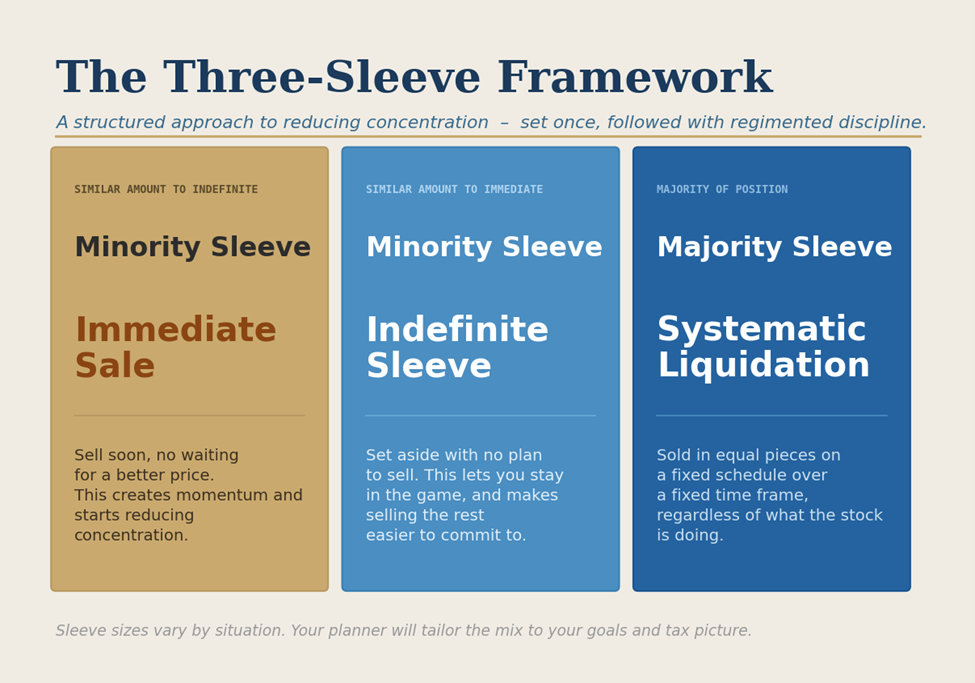
Figure 3: The Three-Sleeve Framework, a structured approach for systematically reducing a concentrated stock position. Systematic Liquidation is the largest sleeve; Immediate Sale and Indefinite Sleeve are typically similar in size. Your planner will tailor the mix to your goals and tax picture.
If you have a concentrated position, you probably already know, on some level, that you should probably take some risk off the table (probably). The issue isn’t awareness. It’s (probably) follow-through. You may fully intend to make a move, and then something stops you. Not because you’re reckless. Because the decision is genuinely hard to make in the moment. The stock may have done well recently, so maybe it keeps going up, and selling now gives you feelings of FOMO. Or it’s down, and selling now feels like locking in a loss. There’s a seemingly good reason to wait either way. So the position just keeps sitting there.
So, here’s where the Three-Sleeve Framework comes into play. Instead of telling yourself you’re going to make a well-timed decision every quarter, you set up a structure in advance and follow it (similar to dollar cost averaging, but in reverse and with shares).
You may also tie it to something real: a home purchase, a college fund, an earlier retirement. Selling with a clear purpose increases the likelihood that it actually happens. Whereas selling as a vague risk-reduction idea could get pushed to next quarter indefinitely (go look at the last graphic again if you need more convincing you’d do otherwise). A financial planner can help you connect the dots between what you’re working toward and how much stock you should sell to get there. Once you have that picture, you divide the position into three parts:
Immediate sale: Sell this piece soon, without waiting for a better price, then reinvest the proceeds. Its only job is to get the ball rolling and start bringing your concentration down.
Indefinite sleeve: Set this aside with no real plan to sell it. It’s your way of staying in the game if the stock takes off. It also makes it a lot easier to sell everything else, because you haven’t completely walked away. (You’re not giving up on the company. You’re just being sensible about the rest.)
Systematic liquidation: Sell this in equal pieces on a fixed schedule over four or five years, regardless of what the stock is doing at the time, and reinvest it accordingly. This is the hardest part to stick to, and usually the most valuable.
The Hardest Part: Actually Doing It
Most quarters, there’s going to be a good reason not to sell. When the stock is up, selling feels like leaving money on the table (look at the chart again, and ask yourself if you’d be diversifying your Microsoft or Apple stock). When it’s down, selling feels like locking in a loss (Again, now go look at Peloton or Pfizer). Both reactions are understandable. Together, they mean nothing ever happens.
The solution is a fixed schedule you set up ahead of time (when you were thinking clearly) plus someone who makes sure the trades actually go through. One of the more underrated things a financial planner brings to the table is that they can handle the implementation directly. The trades go through without having to pass through your emotional filter, avoiding a potential last-minute hesitation.
And because your equity is one piece of a larger financial picture, a planner can also make sure what you’re doing with the stock actually makes sense alongside everything else.
Option Timing: The Leverage Test and the NSO Counterintuition
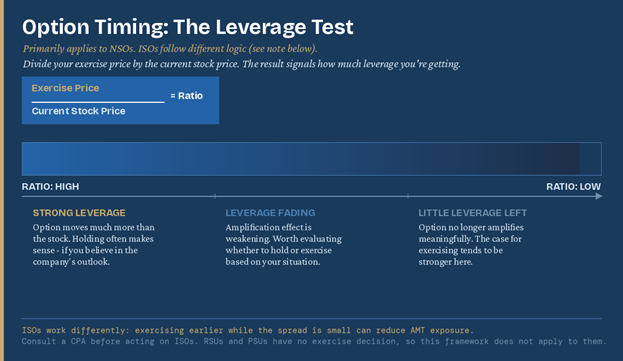
Figure 4: The Leverage Test. Divide your exercise price by the current stock price. A higher ratio means more amplification from holding; as the ratio falls, the case for exercising tends to strengthen.
An unexercised option lets you participate in the stock’s upside without putting up any money or owing any taxes yet. That’s a pretty unusual combination, and it’s worth understanding before you take action. A common practice is to exercise as soon as possible to get the capital gains clock running, but I’m going to suggest there is something else you need to consider first called The Leverage test.
The leverage test is a way to gauge how much of that amplification you’re getting on your stock option. Divide your exercise price by the current stock price. When that ratio is high, the option still moves a lot more than the stock, which means you’re getting real leverage from holding. As it falls, that amplification fades, and the case for exercising tends to get stronger. That said, the ratio is only part of the picture. The company’s health and trajectory matter too, and a high ratio may not be as meaningful if there are real questions about where the business is headed (remember the whole concentration thing we just finished talking about).
Also if you’re planning on leaving the company, your plan documents will tell you how long you have to exercise before the options expire due to leaving the company. It varies, so it’s worth looking that up before you give notice. [7]
For NSOs, exercising early to start the capital gains clock often doesn’t work out the way people expect. The moment you exercise, you pay the purchase price plus income taxes on the gain so far. That immediately shrinks the number of shares you have left working for you (assuming you sell off some shares to take care of the tax bill). If you wait, all of your options keep compounding. Yes, you’ll face a higher tax bill later, but because taxes are a percentage of whatever you gain, that larger bill reflects a larger gain, and in some scenarios, you may keep more after taxes, but outcomes depend on future stock performance, timing, and your tax situation. This logic only holds if the stock continues to grow. If the company stalls or declines, waiting can work against you.
It’s worth calling out that ISOs are a different story. For those, exercising earlier while the spread is still small probably makes more sense, since it may help reduce or avoid AMT exposure down the road. The right call depends on the type of option you have, your tax situation, and where the company is headed (again, an unknown that warrants thinking about reducing concentration). [1]
More Things Worth Thinking About
• The 22% RSU withholding. It’s common practice, but it may not cover your actual tax rate. It’s worth factoring that into your planning so a shortfall doesn’t catch you off guard. [2,3]
• RSUs piling up without a decision. Every time shares vest and you don’t sell, you’re effectively choosing to hold more concentrated stock. That might be fine, but it’s worth making that call intentionally rather than by default by inaction. [2]
• Exercising NSOs early for the capital gains clock. For NSOs, this often reduces the number of shares left compounding and can leave you with less after taxes, not more - though the right answer depends on the company’s trajectory. ISOs work differently: exercising earlier while the spread is small can sometimes reduce AMT exposure. [1]
• Skipping the AMT conversation before exercising ISOs. Exercising can potentially trigger AMT even when you haven’t sold anything yet. Worth a conversation with a CPA before you act. [4,5]
• Not tracking your cost basis. Knowing what you originally paid for your shares, and when, matters a lot when it comes to calculating gains and managing your tax bill. It’s important to not lose track of, especially across multiple grants and exercise dates (surprisingly even in this day and age, this typically isn’t automatically tracked within the account the shares are held in). [1]
• Treating your company’s stock like it can’t go wrong. Even very good companies can hit rough patches. The risk of owning a single stock is real, and it doesn’t go away just because you work there. [6]
Ready to Talk It Through?
If you’ve read this far, you’ve probably noticed how quickly the moving pieces add up. Keeping the rules straight across RSUs, NSOs, ISOs, and PSUs is one thing. Figuring out the optimal strategy for the specific type you have is another. And then there’s the question of how your equity comp fits alongside everything else in your financial life.
The complexity is especially amplified when you also have multiple, or even all of the above types of equity compensation. (I recently ran into this, and it was the catalyst for putting this article together.
If you want help sorting through your own situation, I’d enjoy the conversation.
Sources
All factual claims draw on primary sources: IRS publications, statutory tax code, peer-reviewed academic research, and one practitioner reference for the option exercise framework.
[1] Internal Revenue Service: Topic No. 427: Stock Options Authoritative IRS overview of ISO and NSO tax treatment: when income is recognized, how it is taxed, and required reporting forms.
[2] Internal Revenue Service: Publication 525: Taxable and Nontaxable Income IRS publication covering the tax treatment of various compensation types, including stock-based compensation. Confirms that RSU income is recognized at vesting as ordinary income and reported on Form W-2.
[3] Internal Revenue Service: Publication 15 (Circular E): Employer's Tax Guide Establishes the 22% flat supplemental wage withholding rate (37% on amounts above $1 million) that applies to RSU vesting income.
[4] Cornell Law LII: 26 U.S. Code § 422: Incentive Stock Options Full statutory text of IRC Section 422: qualifying disposition holding periods (2 years from grant, 1 year from exercise), the $100,000 annual ISO cap, and conditions under which favorable tax treatment is lost.
[5] Internal Revenue Service: Topic No. 556: Alternative Minimum Tax IRS overview of the Alternative Minimum Tax, including how ISO exercises can trigger AMT liability and the rules for calculating the AMT adjustment on incentive stock options.
[6] Harry Markowitz, The Journal of Finance: Portfolio Selection (1952) The foundational paper establishing Modern Portfolio Theory (JSTOR archive of the original publication). Diversification optimizes the risk-return trade-off, and a diversified portfolio dominates a concentrated single-asset position on a risk-adjusted basis. Awarded the 1990 Nobel Memorial Prize in Economic Sciences.
[7] Carta: How Stock Options Are Taxed: ISO vs. NSO Tax Treatments Practitioner reference on option leverage, ISO/NSO tax differences, and frameworks for exercise timing decisions.
This post is for educational purposes only and does not constitute tax, legal, or investment advice. Please consult a qualified financial planner, CPA, and/or attorney before making decisions about your equity compensation.
Investment advisory services are offered through Fiduciary Financial Advisors, a registered investment adviser. This material is for educational and informational purposes only and is not individualized investment, tax, or legal advice. Equity compensation rules are complex and outcomes depend on plan terms, trading windows, holding periods, and individual tax circumstances. Consult your CPA and/or attorney regarding your situation. Any performance shown is historical, for illustrative purposes, and does not indicate future results. Examples are not representative of all securities or outcomes and are not recommendations to buy or sell any security. Data may be obtained from third-party sources believed to be reliable but not independently verified.”

Yours, Mine, and Ours: A Field Guide to Combining Finances (Without the Headache)
When couples combine finances, the real challenges are rarely about math. They're about autonomy, fairness, and trust. This guide walks through four approaches to merging money (from fully separate to fully joint), explains how financial needs shift across life stages, and outlines the legal risks of changing asset titling without professional counsel. Written for high-earning professionals navigating income disparity, career transitions, and the emotional weight of financial intimacy.
There is no "right" way to merge money with a partner, but there are efficient ways to do it. Here is how couples with successful careers navigate the emotional and logistical transition from separate to fully joint.
Stop spending your valuable time on administration.
A quick, 30-minute intro to see if we're a good fit.

Read Andrew’s Story
Key Takeaways From This Article:
Hiring an advisor makes sense when your financial success creates gaps that DIY management can no longer effectively or efficiently fill.
Mind Over Math:
The friction in combining finances is rarely about the math; it is about autonomy, control, and the fear of judgment.
The "Roommate" Trap:
Keeping finances strictly separate can create a transactional dynamic that feels unromantic and exhausting over time for couples.
The Executive Shift:
As careers peak and time becomes scarcer than money, couples often merge finances simply to reduce "cognitive load" and administrative fatigue.
Legal Reality:
Changing titling on assets (ownership) is a major legal event. Do not conflate "feeling married" with "commingling inheritance/pre-marital assets" without legal counsel.
Let’s just get this out of the way immediately: There is no single "correct" way to combine finances with your romantic partner. The right way differs from couple to couple, and frankly, it differs for the same couple depending on the season of life they are in.
I get asked about this constantly. Usually, the question isn't prompted by a banking issue; it's prompted by a feeling. Maybe one partner feels like they are "subsidizing" the other. Maybe one feels controlled. Or maybe you are just tired of Venmoing your spouse for half the electric bill like they are a college roommate.
For executives, the emotional stakes are higher because the numbers are bigger. When you have two high-performing individuals, you deal with:
Autonomy:
You are used to calling the shots in your professional life; asking permission to buy a new watch feels regressive.
Disparity:
Often, careers in a dual income household don’t follow the same trajectory, and one income accelerates faster than the other, creating a Primary Earner vs. Support dynamic that can breed quiet resentment if not managed.
Today, let's look at the plumbing: spending, bank accounts, and credit cards; but through the lens of how these systems actually feel.
Some Different Approaches You Can Choose From
Imagine a spectrum. On one end, Total Autonomy. On the other, Radical Transparency.

Separate Accounts Without Tracking
Keep all accounts separate and trust that expenses will even out.
This is the "you grab dinner, I'll grab the movie tickets" approach.
Why it works: It preserves maximum autonomy. You never have to justify a purchase.
The catch: It relies entirely on feelings, not facts. Over time, the partner who handles the lifestyle expenses (dinners, vacations) can lead to resentment against the partner who pays for the living expenses (groceries, utilities), feeling that the split isn't actually fair.
Separate Accounts With Account Balancing
Keep accounts separate and “invoice” each other.
You use a spreadsheet or app to track expenses, reconciling at the end of the month.
Why it works: It provides safety and fairness. You know exactly where you stand.
The catch: It can erode romance by introducing a transactional component to the relationship. A romantic relationship is a partnership, not a vendor contract. If you are calculating who ate more of the pizza, you are missing the point.
Hybrid Model: Separate Personal & Joint Operating Accounts
Maintain separate accounts for personal use, plus a joint checking account for shared bills.
You fund a joint account for the mortgage/utilities, but keep your own "fun money" separate.
Why it works: This is often the largest psychological hurdle to overcome, but can be highly rewarding for couples who value both shared structure and personal autonomy. It creates a "We" regarding the household, but preserves the "Me" for personal choices. You avoid the "why did you spend that much on golf/shoes?" argument entirely.
The catch: The friction here is usually about contributions. If one of you earns $500k and the other earns $100k, do you constrain your lifestyle so that a 50/50 split feels fair? Or do you live a lifestyle based off of the higher earner and figure out what is a fair contribution by each partner?
Fully Joint Accounts
All accounts are joint.
All income hits one bucket; all expenses leave that bucket.
Why it works: This requires "Financial Intimacy." There are no secrets. It fosters a sense of being a single economic unit, which can be incredibly bonding and daunting at the same time.
The catch: Loss of identity. Some people feel belittled if they have to "explain" a purchase from the joint pot. It also carries the highest liability: if the relationship sours, the money is accessible to both parties equally.
Different Seasons of Life (And Why You Will Likely Change)
You won't pick one system and stay there forever. As your life gets more complex, your need for efficiency usually overrides your desire for separation.
The Trust-Building Phase (Dating/Living Together)
The feeling: "I love you, but I don't know if you're good with money yet."
The behavior: You keep things separate because you are protecting yourself. This can be healthy. You are establishing trust and observing each other's habits without risking your own financial security.
The "Cognitive Load" Phase (Marriage & Kids)
The feeling: "I am too tired to do math."
The behavior: This is usually where the shift happens for many households. You are managing teams at work, and toddlers at home. You do not have the mental bandwidth to calculate pro-rata shares of a utility bill. You merge finances not because it's romantic, but because it reduces administrative fatigue. Efficiency becomes the ultimate currency.
The "Income Disparity" Phase (The Executive Leap)
The feeling: "Is this our money, or my money?"
The behavior: Often in your 40s or 50s, one partner’s income explodes (equity events, a sizable promotion) while the other may downshift to focus on the home or stay steady.
If you keep separate accounts here, the power dynamic can get weird. One person wants to fly business class; the other can only afford economy.
This is where moving to "Joint" or "Pro-Rata Hybrid" becomes more useful to preserve the emotional health of the marriage. It signals that the win for one is a win for the family.
A Personal Perspective
When my wife and I started out, we were strictly in the separate camp. We didn't track joint expenses; we simply took turns paying for things: I’d buy the dinner; she’d buy the ice cream. It wasn't a system, it was just a distinct lack of one.
As we moved into the Cognitive Load season, maintaining separate silos became a job neither of us wanted. We shifted to joint accounts out of sheer laziness and a need for speed and accessibility.
But the real emotional shift happened when we stopped viewing money as a scorecard and started viewing it as fuel for a shared vision. We treated the household as a single business entity. This became crucial when our careers shifted: I started my practice, she began working from home to spend more time with our kids, and "mine vs. yours" became a laughable concept compared to "ours."
A Word of Caution: The Legal Reality

While I encourage you to find an emotional rhythm that works, never ignore the legal reality.
Titling is Ownership: Changing an account from "Individual" to "Joint" isn't just a settings change; it's a gift. In many cases, it makes that money 50% theirs immediately.
Pre-Marital Assets: If you are coming into a relationship with significant executive compensation, inheritance, or property, keep it separate until you have spoken to an estate attorney. You can share the fruit of the tree (spend the income) without chopping down the tree and splitting the wood (changing ownership of the principal).
The Core Issue
Combining finances is 20% math and 80% psychology.
If you are fighting about the logistics, you are probably actually fighting about control or fairness. If your current system feels heavy, it’s time to move to the next season. Just make sure you talk to a professional before you sign the paperwork.
You deserve a partner whose incentives are 100% aligned with yours.
Speak directly with a fiduciary. No sales pressure.
Other Recent Articles By Andrew:
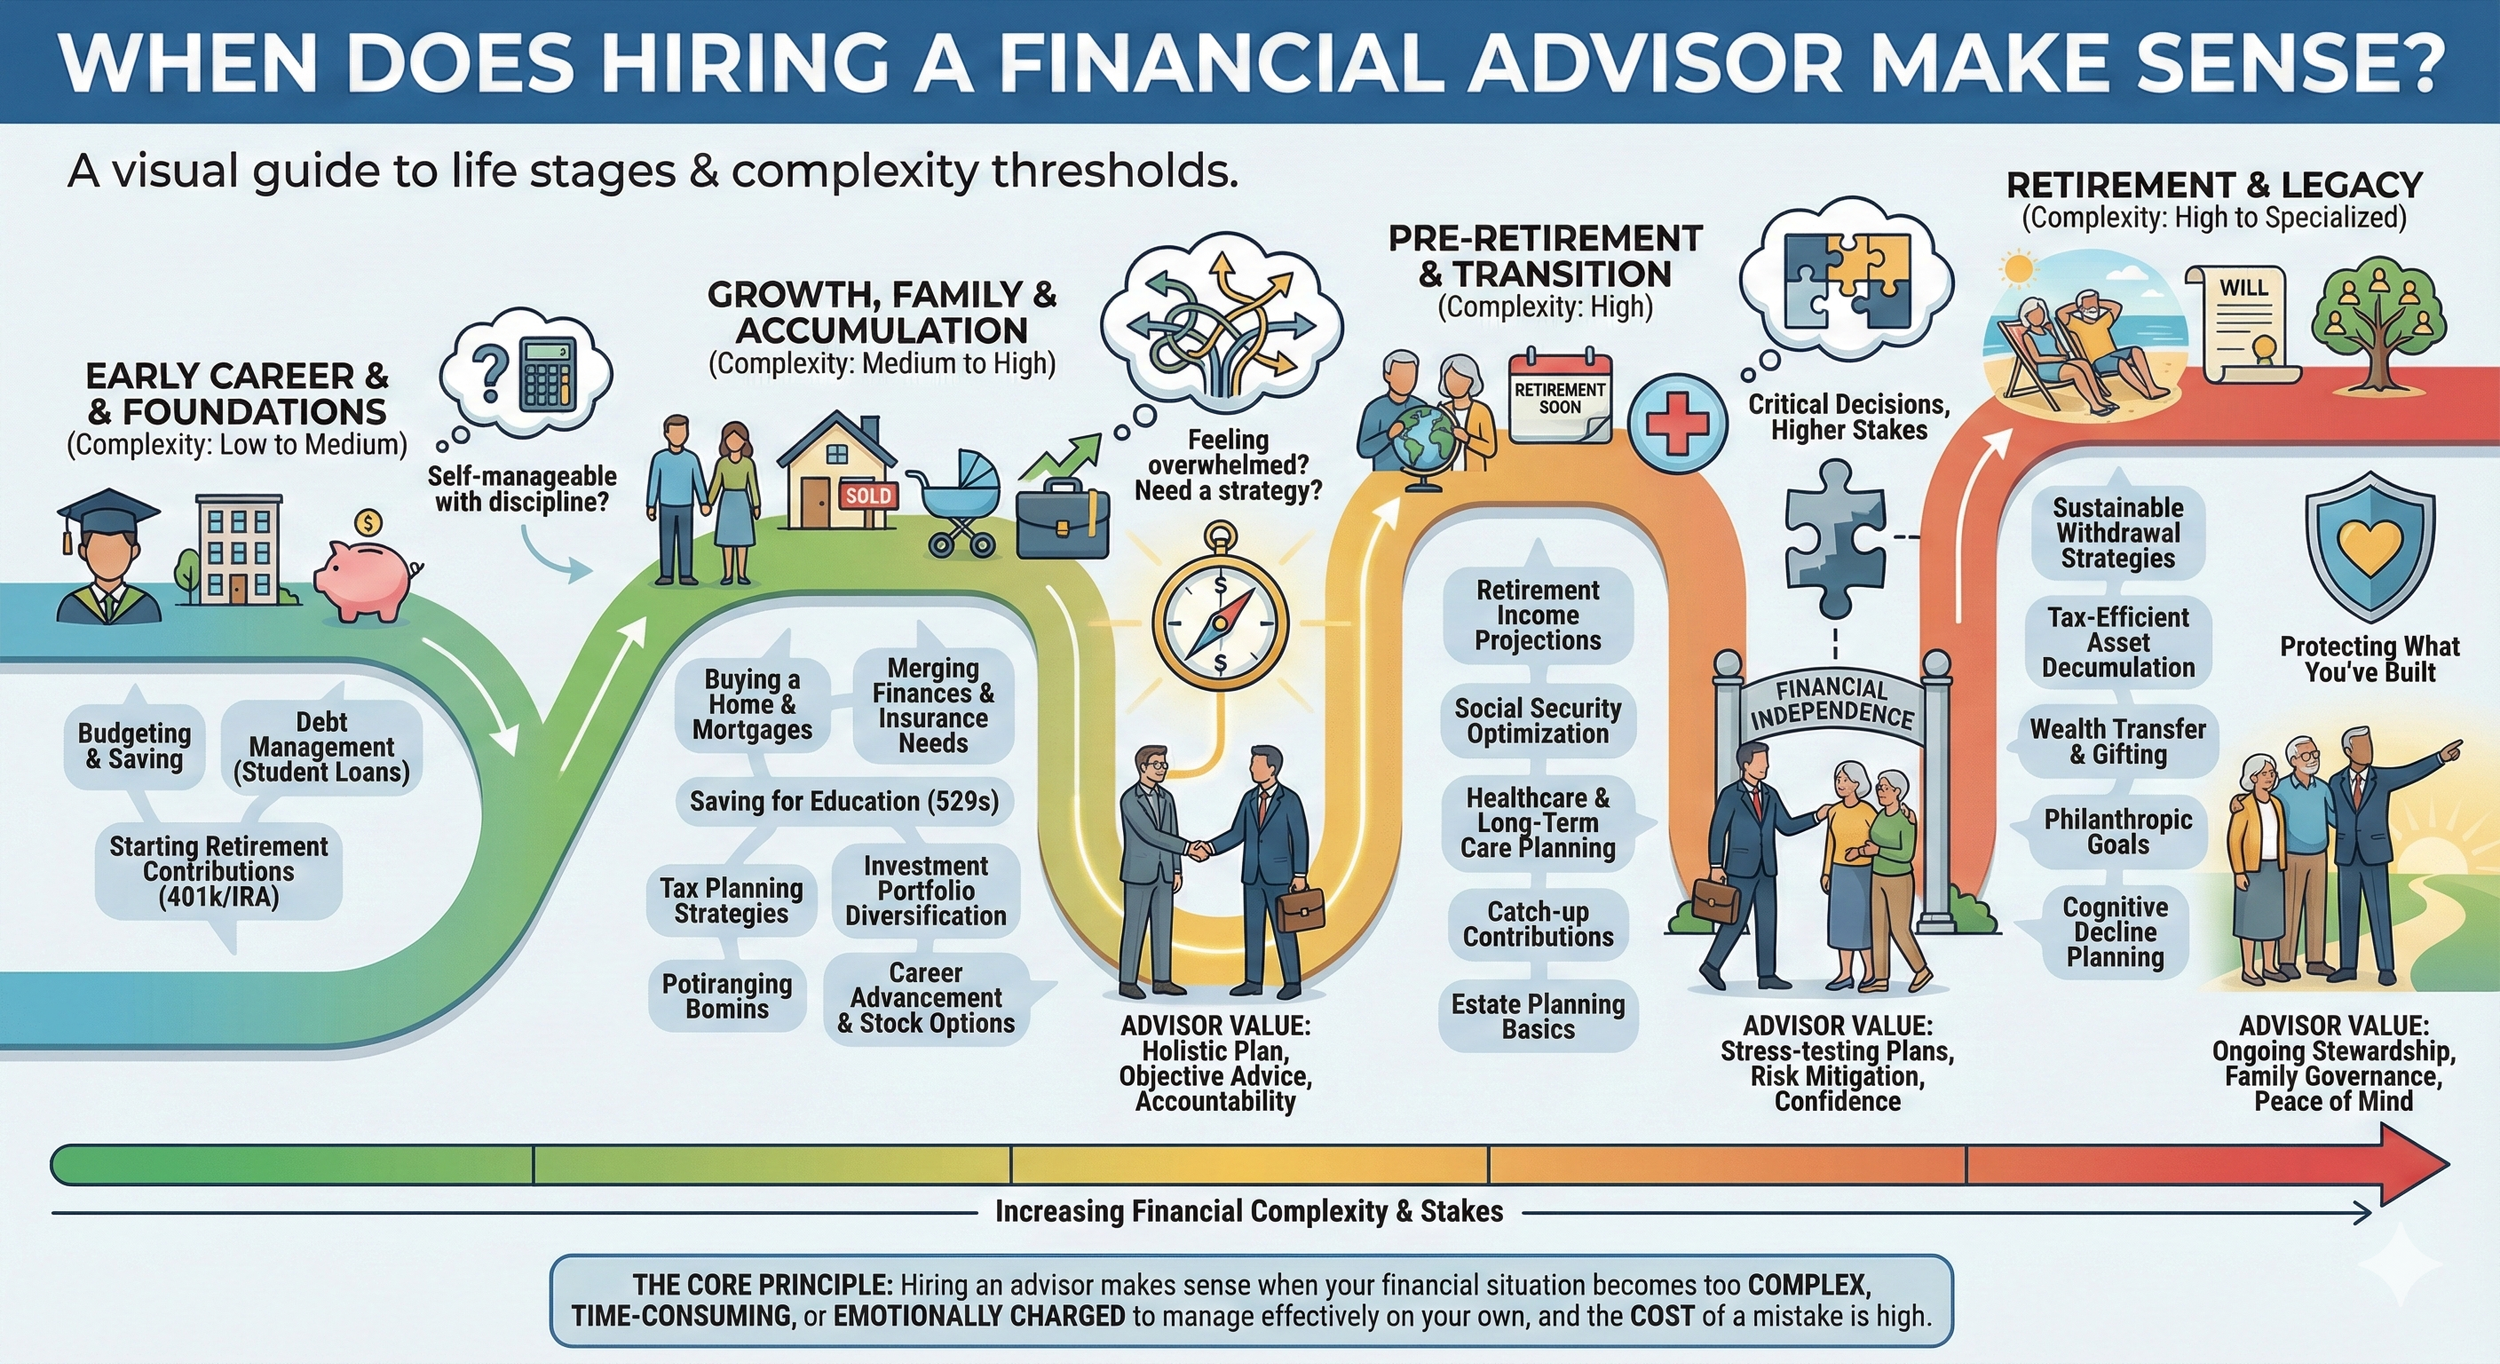


Recent Publications Featuring Andrew:


Podcasts Featuring Andrew:


Investment advisory services are offered through Fiduciary Financial Advisors, a registered investment advisor. This content is for informational and educational purposes only and is not individualized investment, tax, or legal advice. Consider your objectives and circumstances before acting and consult qualified professionals (including an attorney) regarding legal and titling decisions.

The True Value of Professional Investment Management: Why It's Not About Beating the Market
Ask people why they hired a financial advisor and almost none of them say "to beat the market." They say they wanted accountability, help making sense of complexity, or simply to stop spending their weekends on it. This piece walks through where research suggests professional management may add value over time, from cost-effective implementation and rebalancing to tax and withdrawal planning, and why the largest contribution tends to be keeping investors from costly decisions at market extremes.

TL;DR
Professional investment management isn't about beating the market, it's about making better decisions consistently. Research suggests advisors may add value over time through areas such as implementation, rebalancing, behavioral coaching, tax considerations, and withdrawal planning; the magnitude and timing of any benefit varies by investor and market conditions. The biggest value? Preventing costly emotional mistakes during market extremes. Even capable DIY investors often benefit from professional guidance while freeing time for what they actually enjoy.
Interested in exploring whether professional management might add value? Let's discuss your goals, current approach, and whether we might work well together.
Note: "bps" = basis points. See explanation below.
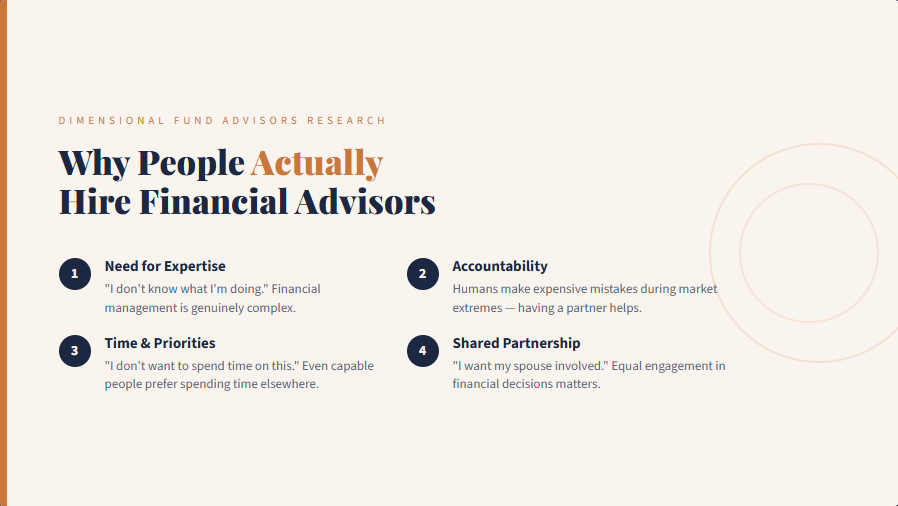
What Actually Motivates People to Hire Advisors?
Dimensional Fund Advisors research identified four reasons families hire advisors:¹
"I need help, I don't know what I'm doing." Financial management is complex.
"I need accountability." Humans make expensive mistakes during market extremes.
"I don't want to spend time on this." Even capable people prefer allocating time elsewhere.
"I want my spouse involved in our financial decisions." Equal partnership in money matters is critical.
Notice what's missing? "I want someone who can beat the market."
"I Don't Want to Spend Time on This"
Even if you possess every skill needed to manage investments effectively, you might reasonably prefer not to. Your time and mental energy may be better spent elsewhere.
Investment management might rank between "tedious chore" and "necessary evil" on your preferred activities list. Your calendar already bursts with obligations. Or perhaps having one partner shoulder the entire investment burden creates uncomfortable dynamics.
What if you could build a relationship with a trusted financial professional and simply know it's handled competently?
While you might be capable of DIY investing, choosing not to is valid.
The Research: Quantifying Adviser's Alpha
Vanguard research suggests that following certain practices may improve investor outcomes over time, though results vary and are not consistent year to year.2 This isn't predictable annual outperformance, it's irregular value-add peaking when investors are most tempted to abandon well-designed plans.
Investment management encompasses vastly more than choosing funds. The real value lies in everything around those choices.
A Quick Note on Basis Points
"Basis points" (bps) measure small percentages:
1 basis point = 0.01%
100 basis points = 1%
So "~150 basis points" means approximately 1.5% annually. "34-70 basis points" means 0.34% to 0.70%.
Why use basis points? These small differences compound dramatically over decades. A 50 basis point (0.50%) annual advantage can mean tens or hundreds of thousands of dollars over 30 years.
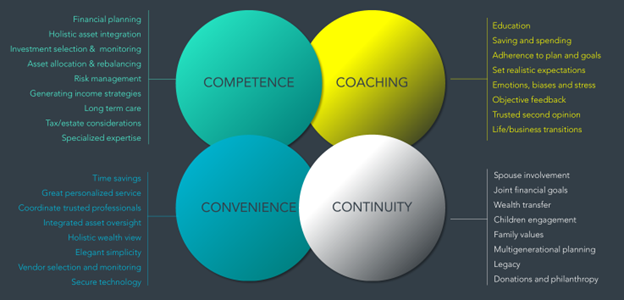
The Four Pillars of Value
Dimensional organizes the value proposition into: Competence, Coaching, Convenience, and Continuity.¹
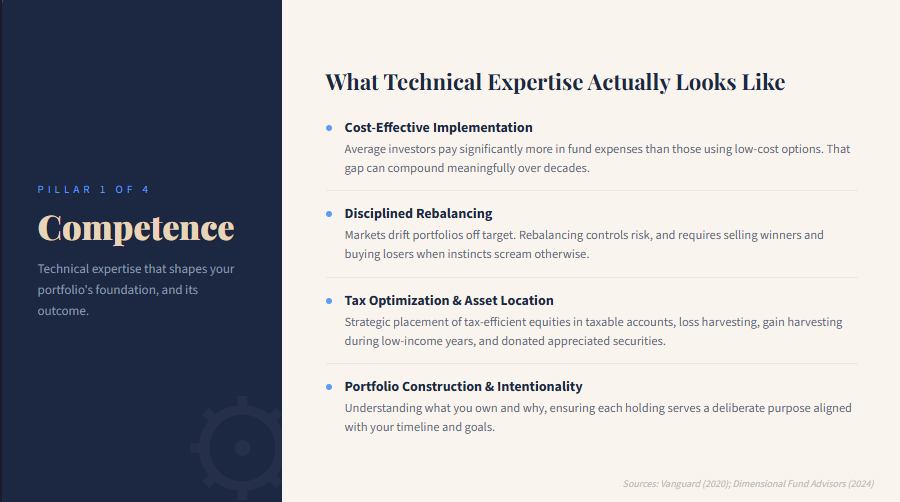
1. Competence: Technical Expertise That Matters
Cost-Effective Implementation
Average investors pay 57-79 bps annually in fund expenses. Those using low-cost funds pay just 16-20 bps. This 34-70 bps differential compounds relentlessly over decades.³
Understanding Your Portfolio Composition
Many investors contributing for years without a coherent philosophy end up with suboptimal portfolios. The most common pattern I see: significant overconcentration in the S&P 500 through multiple index funds, target-date funds that hold S&P exposure, and individual holdings that overlap with the index.
When we review these portfolios, clients often realize for the first time that they have virtually no exposure to smaller U.S. companies, international markets, or meaningful fixed income allocation. Everything is essentially the same 500 large-cap U.S. stocks, held multiple times across different accounts.
Your portfolio's composition (asset allocation and market exposure) is your returns' primary driver. It's about intentionally accessing different sources of expected return across size (large vs. small), geography (U.S. vs. international vs. emerging), and asset classes (stocks vs. bonds vs. real estate).
Heavy concentration in the S&P 500 is an implicit bet that large-cap U.S. stocks will keep outperforming everything else. That might work. Or not. But it should be conscious, not accidental.
Beyond knowing what you own, you need to know why. Your investment strategy should connect directly to actual financial goals.
We examine both sides: return drivers (asset allocation, market exposure, emphasizing higher expected return areas) and cost drags (implementation costs, taxes, expense ratios). We evaluate every holding: keep, sell, or donate, ensuring each serves a deliberate purpose aligned with your timeline and goals.
Your net returns come from assembling these components thoughtfully. Not just picking "best" funds, but how everything works together.
Converting Idle Cash Into Working Capital
Cash accumulation where it shouldn't be is widespread: substantial balances in checking/savings without purpose, RSU proceeds languishing, or money transferred to investment accounts but never deployed. We systematically review and invest these idle positions.
Disciplined Rebalancing: 14-30 Basis Points
Market movements push portfolios from target allocations. A portfolio designed with a certain stock/bond mix will naturally drift as different asset classes perform differently. Rebalancing primarily controls risk.⁴ A portfolio that's drifted to hold more stocks than intended has taken on more volatility and downside exposure than originally planned.
The challenge? Rebalancing is psychologically uncomfortable, selling winners and buying losers when instincts scream otherwise.
Calibrating Risk to Timeline
Risk is the probability of insufficient funds when needs arise. Someone purchasing a home in five years needs dramatically different allocation than someone two decades from retirement.
We construct appropriate equity/fixed income/cash combinations based on your timeline and risk tolerance. Vanguard research shows simple portfolios (like 60/40 index funds) deliver returns comparable to complex endowment portfolios.⁵ Simplicity has genuine advantages.
Tax Optimization: 0-100 Basis Points
The goal: minimize lifetime tax burden, not this year's bill. Sometimes accepting higher current taxes positions you for dramatically lower lifetime taxes.
Strategies include:⁶
Strategic asset placement (tax-efficient equities in taxable accounts, bonds in retirement accounts)
Loss harvesting during declines
Gain harvesting during low-income years
Replacing tax-inefficient funds
Donating appreciated securities versus cash
Retirement Withdrawal Strategies: 0-120 Basis Points
For retirees with multiple account types, withdrawal order significantly impacts lifetime taxes. Informed strategies add 0-153 bps annually while extending portfolio longevity.⁷
And Many More
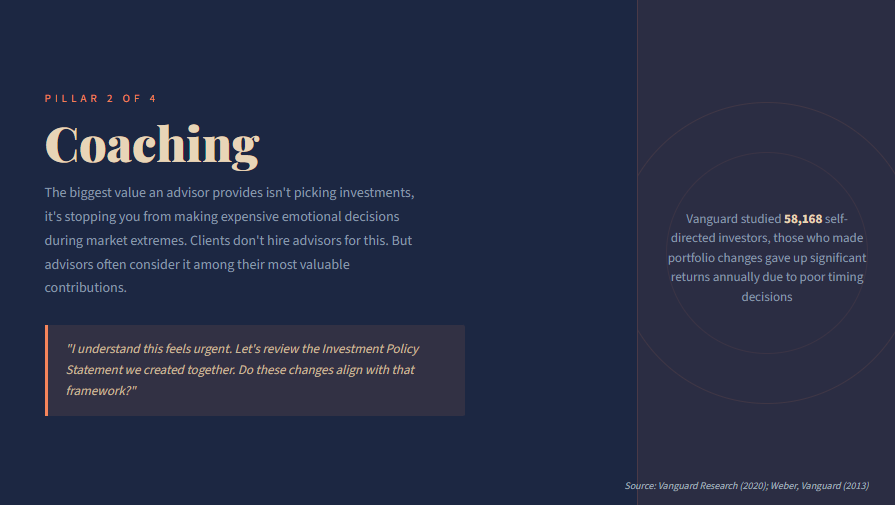
Research suggests over 100 distinct ways advisors add value across planning domains.¹³ Effective advisors go deep on services most relevant to their clients' needs.
2. Coaching: The Behavioral Advantage (The Biggest Value-Add)
Behavioral coaching potentially adds up to 200 basis points annually, the single most valuable service advisors provide.⁸
Here's a paradox: clients don't hire advisors for emotional guidance. Yet advisors recognize this as among our most valuable contributions.
Vanguard analyzed 58,168 self-directed investors: those who made portfolio changes sacrificed 104-150 bps due to poor market timing.⁹ European analysis revealed investors consistently underperforming their own fund holdings, a persistent "behavior gap."¹⁰
The pattern: when markets surge, investors extrapolate gains indefinitely and increase risk. When markets crash, fear drives capitulation at exactly the wrong moment.
An advisor's function during these periods is rational perspective: "I understand this feels urgent. Let's review the Investment Policy Statement we created together. Do these changes align with that framework?"
Clients engage advisors not from lack of intelligence, but recognizing the value of accountability.¹¹ Advisors aren't immune to emotion, we've developed systematic processes prioritizing rational analysis over emotional reaction.
Building relationships before market extremes enables advisors to function as behavioral circuit breakers.
3. Convenience: Integrated Management and Peace of Mind
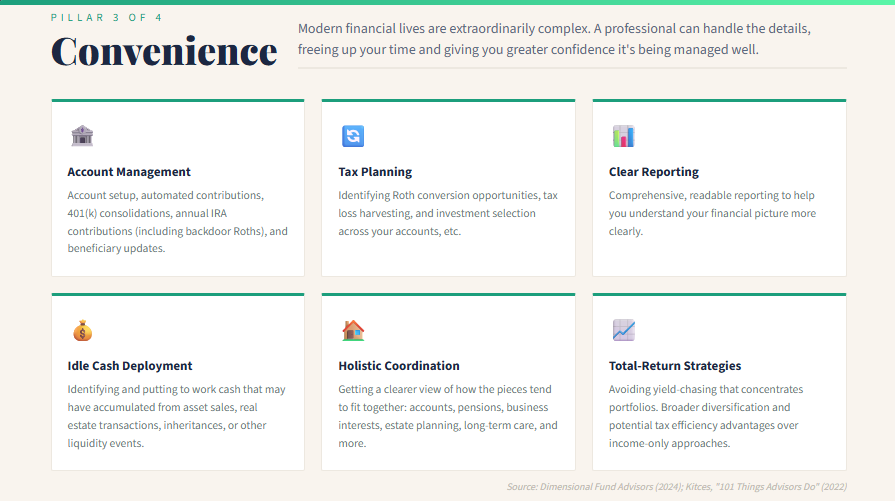
Modern financial lives are extraordinarily complex: multiple accounts, former employer plans, pensions, business interests, estate planning, tax optimization, long-term care.
Families engage advisors to spend time with family rather than managing portfolios, gain professional oversight, ensure continuity for spouses/children, and have someone seeing how all pieces fit together.
Navigating Administrative Complexity
We help navigate (often handling directly) tasks like: account establishment, automated contributions, 401(k) consolidation, Roth conversions, annual IRA contributions including backdoor Roths, investment selection in employer plans/HSAs, beneficiary updates, trust funding, among many other administrative details that would otherwise consume your time and attention.
Clear, Comprehensive Reporting
Quality reports help you understand your portfolio without needing an advanced degree.
Total-Return vs. Income-Only Strategies
With suppressed bond yields, many retirees' portfolios don't generate sufficient income. The temptation: chase yield through high-yield bonds or dividend strategies.
The problem? These typically concentrate portfolios, reduce diversification, and often expose principal to greater risk than disciplined total-return strategies.¹²
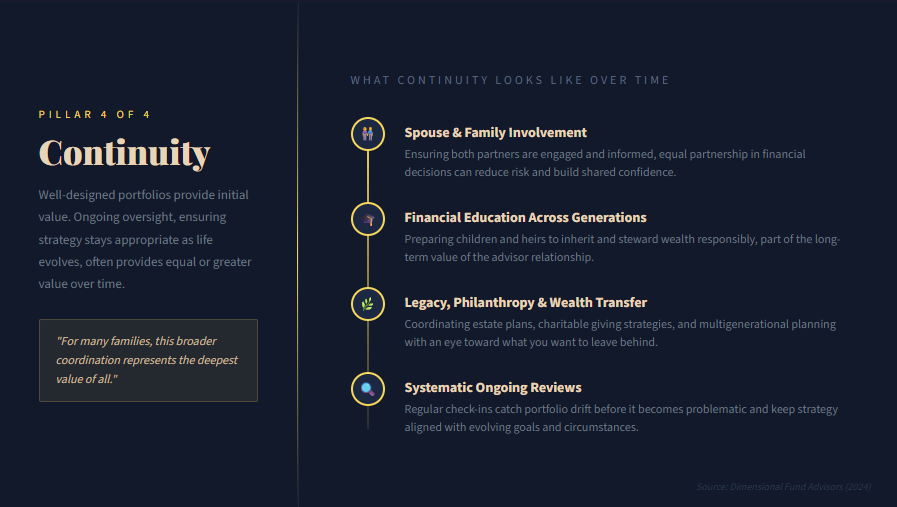
Total-return approaches (considering both income and appreciation) can provide broader diversification, potential tax efficiency advantages, and may support portfolio sustainability depending on the investor’s circumstances.
4. Continuity: Family, Legacy, and Multigenerational Planning
Professional advisors facilitate spouse involvement, children's financial education, wealth transfer, philanthropy, multigenerational planning, and legacy creation.
For many families, this broader coordination represents the deepest value.
Systematic Ongoing Reviews
Well-designed portfolios provide initial value. Ongoing oversight ensuring strategy remains appropriate, provides equal or greater value over time. Regular reviews catch drift before it becomes problematic.
The Quantified Value
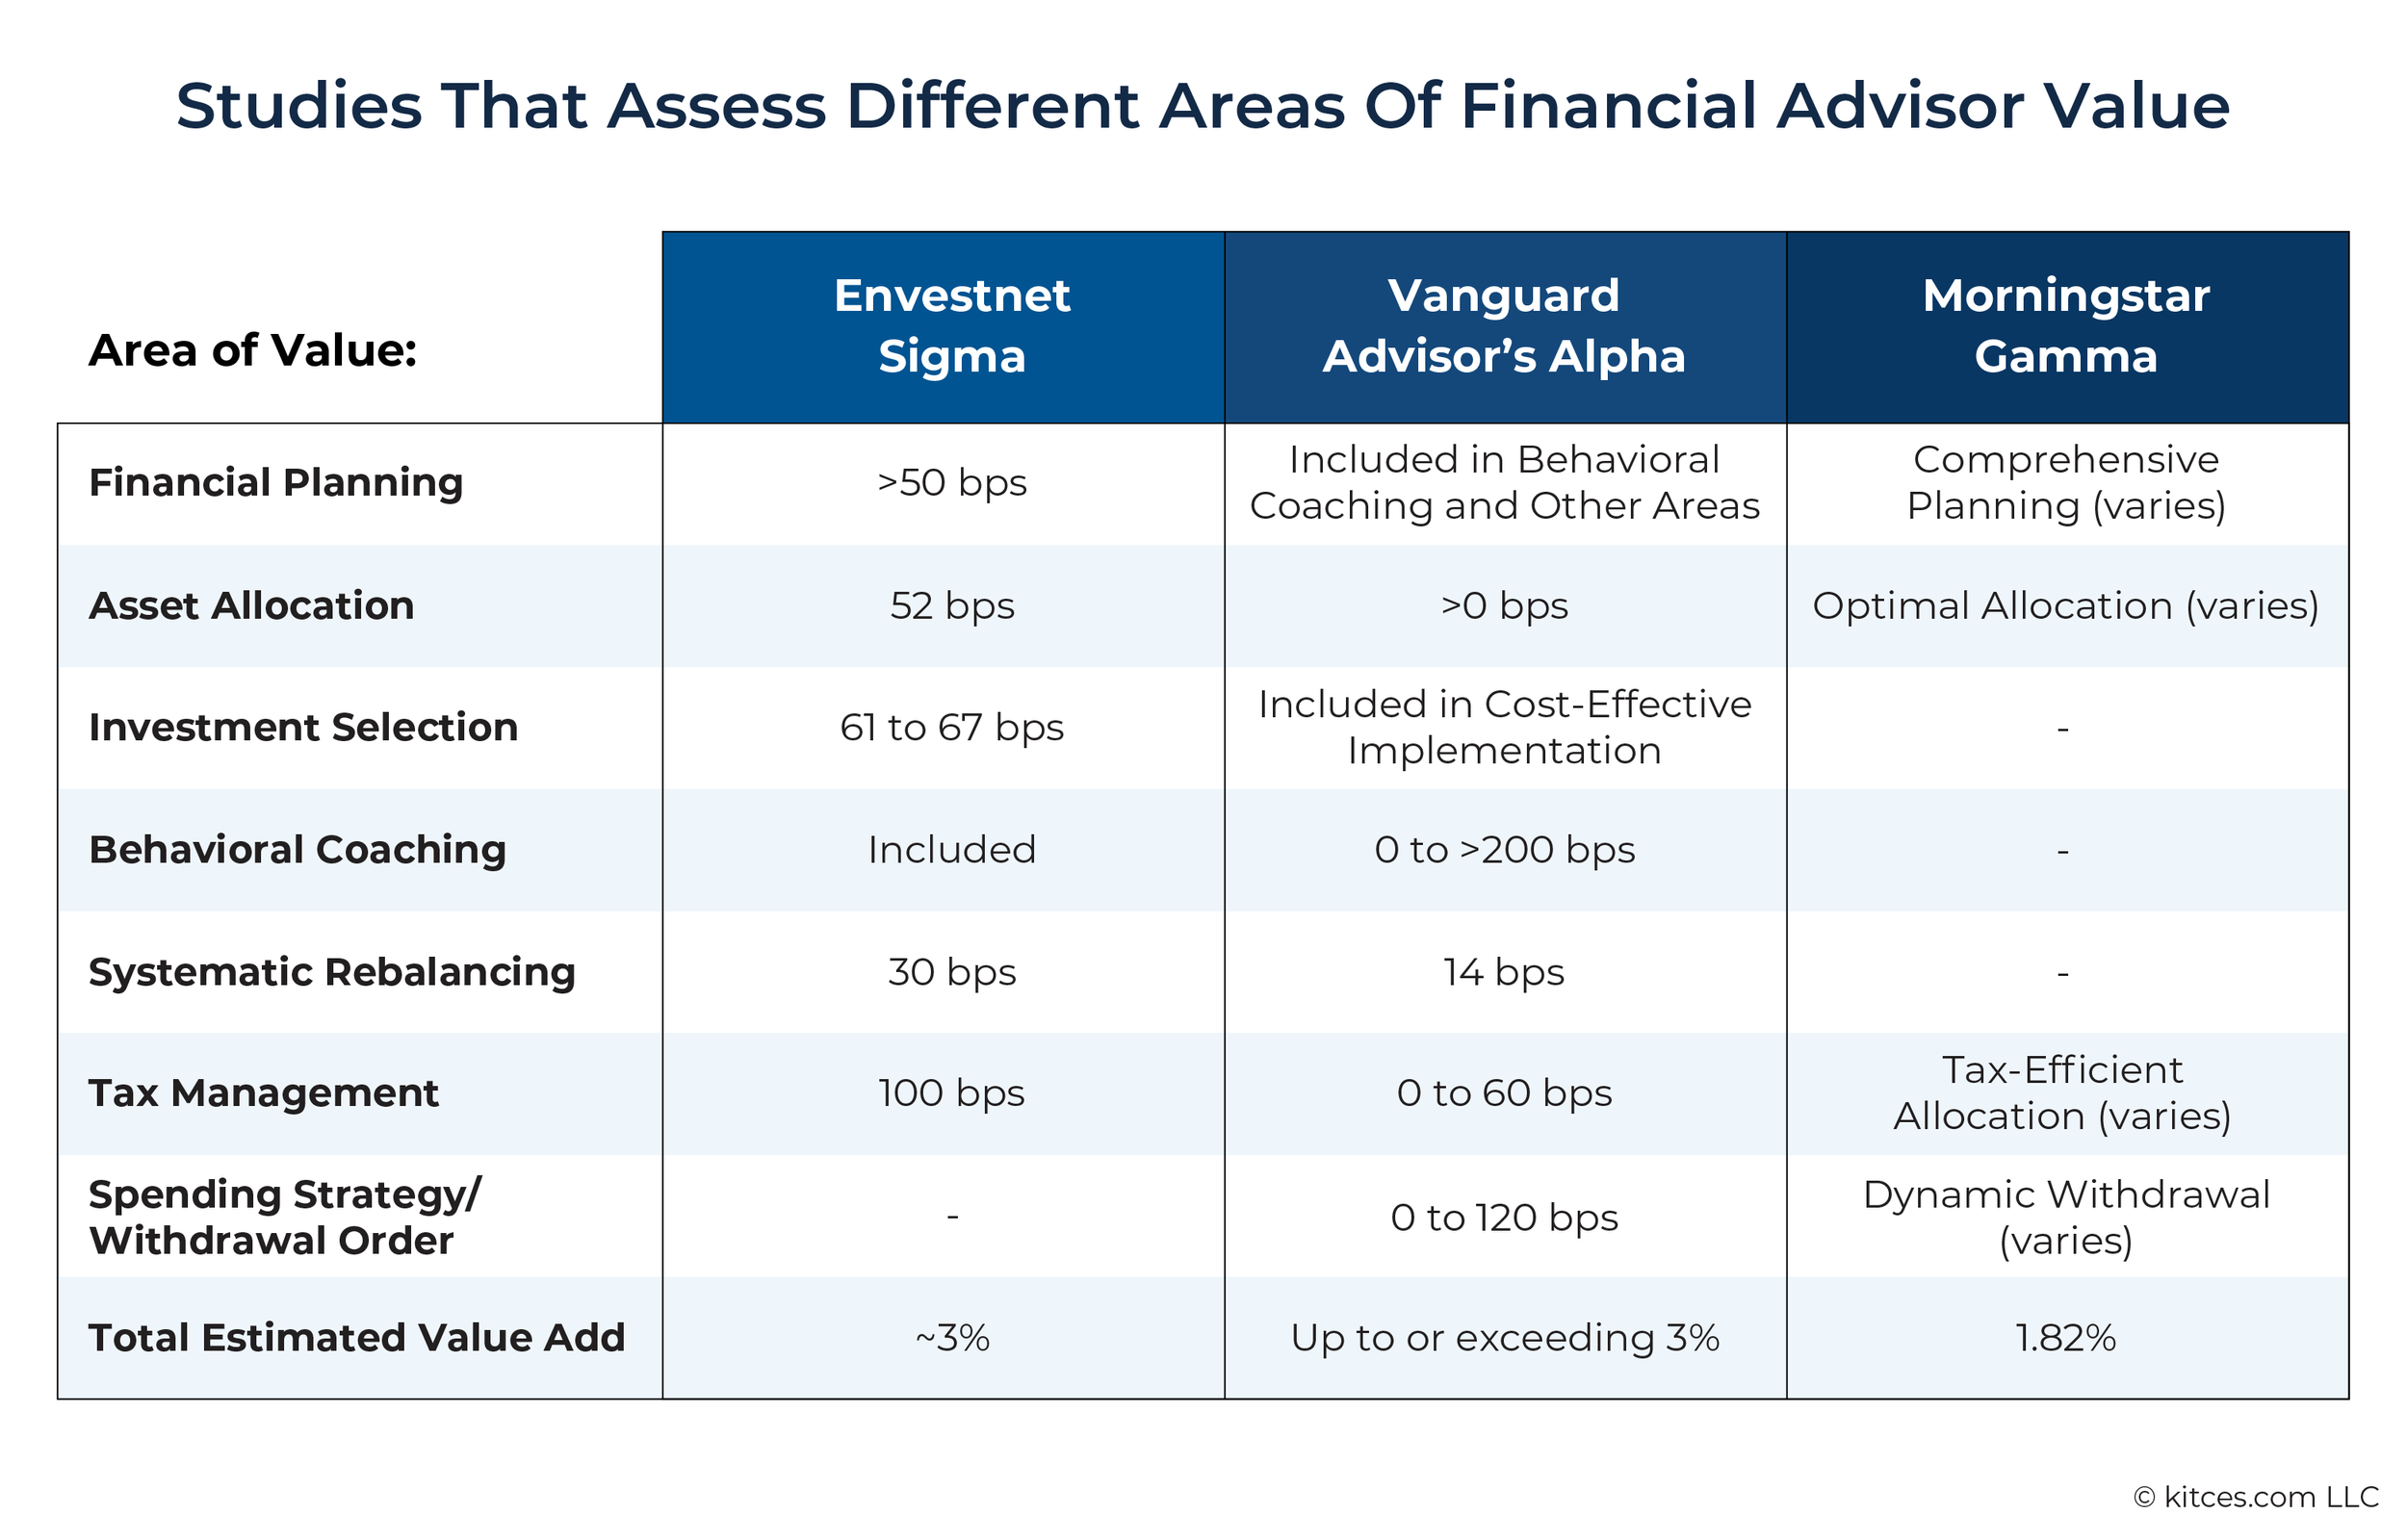
Research shows:
Value varies by circumstances, but cumulative effects meaningfully improve outcomes.²
The Bottom Line
The true value isn't about "delivering" returns or picking winning stocks.
It's about making better decisions consistently, avoiding behavioral mistakes during emotional moments, creating clarity amid complexity, ensuring money serves your goals, maintaining discipline when instincts scream otherwise, and handling administrative minutiae.
Investment selection is part of professional management. But comprehensive planning, behavioral coaching, tax optimization, administrative execution, and coordinated oversight typically create the most significant impact.
The question isn't "Can I manage investments myself?"
It's: "Would I make consistently better decisions (and feel genuinely confident) with a professional partner? Would I rather spend my time and energy on things I enjoy?"
For many, research and experience strongly suggest yes. And unlike beating the market, those are areas where we aim to provide support and a disciplined process, based on each client’s circumstances.
Interested in exploring whether professional management might add value? Let's discuss your goals, current approach, and whether we might work well together.
Sources and References
¹ Lupescu, Apollo. "Communicating the Value of Your Advice." Dimensional Fund Advisors Applied Communications Workshop, November 13, 2024.
² Kinniry, Francis M. Jr., Colleen M. Jaconetti, Michael A. DiJoseph, Yan Zilbering, Donald G. Bennyhoff, and Georgina Yarwood. "Putting a Value on Your Value: Quantifying Adviser's Alpha." Vanguard Research, June 2020.
³ Ibid. Analysis based on asset-weighted expense ratios across mutual funds and ETFs available in Europe as of December 31, 2019.
⁴ Ibid. Vanguard research on portfolio rebalancing showing value-add of 26-86 basis points depending on market conditions and geography.
⁵ Based on 2019 NACUBO-Commonfund Study of Endowments, as cited in Kinniry et al., "Putting a Value on Your Value: Quantifying Adviser's Alpha."
⁶ Kinniry et al., "Putting a Value on Your Value: Quantifying Adviser's Alpha." Asset location value-add ranges from 0-110 basis points depending on jurisdiction and individual circumstances.
⁷ Harbron, Garrett L., Warwick Bloore, and Josef Zorn. "Withdrawal Order: Making the Most of Retirement Assets." Vanguard Research, 2019, as cited in Kinniry et al.
⁸ Kinniry et al., "Putting a Value on Your Value: Quantifying Adviser's Alpha." Behavioral coaching estimated at approximately 150 basis points annually.
⁹ Weber, Stephen M. "Most Vanguard IRA Investors Shot Par by Staying the Course: 2008–2012." Vanguard Research, 2013, as cited in Kinniry et al.
¹⁰ Kinniry et al., "Putting a Value on Your Value: Quantifying Adviser's Alpha." Analysis of European investor returns versus fund returns showing median negative gaps across categories.
¹¹ Bennyhoff, Donald G. "The Vanguard Adviser's Alpha Guide to Proactive Behavioural Coaching." Vanguard Research, 2018, as referenced in Dimensional Fund Advisors communications.
¹² Kinniry et al., "Putting a Value on Your Value: Quantifying Adviser's Alpha." Discussion of total-return versus income-only investing strategies for retirees.
¹³ Van Deusen, Adam. "101 Things That Advisors Actually DO To Add Value (Beyond Just Allocating A Portfolio)." Kitces.com, November 28, 2022. Available at: https://www.kitces.com/blog/advisors-add-value-proposition-financial-planning-ideal-clients-target-persona-differentiation/
¹⁴ Tharp, Derek. "Quantifying (More Accurately) The Real Impact Of A Financial Advisor's Costs On Their Clients' Nest Eggs." Kitces.com, October 23, 2024. Available at: https://www.kitces.com/blog/financial-advisor-costs-fees-aum-fee-only-high-new-worth-ramit-sethi-facet/
Certified Financial Planner Board of Standards, Inc. (CFP Board) owns the CFP® certification mark in the United States, which it authorizes use of by individuals who successfully complete CFP Board's initial and ongoing certification requirements.

Financial Wellness Isn't Optional, It's Foundational
You track your steps, hit the gym, and meal prep. Financial health rarely gets the same attention, even though money is the leading factor Americans point to when they talk about what's hurting their mental health. This piece reframes financial wellness as a form of wellness rather than a chore, walks through six areas it actually covers, and looks at what the research says about where guidance tends to help most.
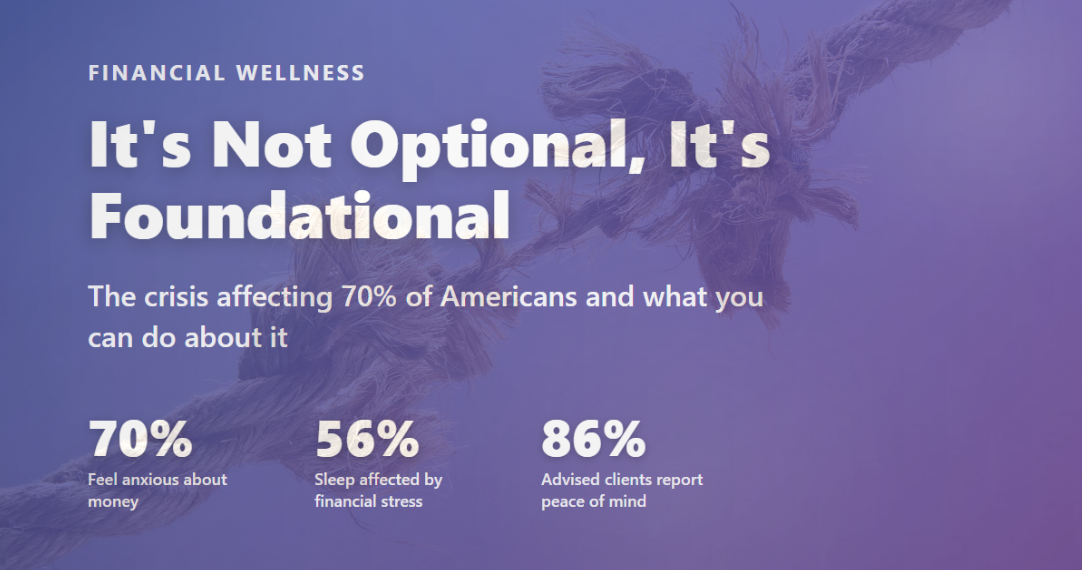
You track your steps. You hit the gym. You meal prep. You've mastered the wellness routines that optimize your physical and mental health. But there's one dimension of wellness you might be overlooking.
The Hidden Health Crisis No One Talks About
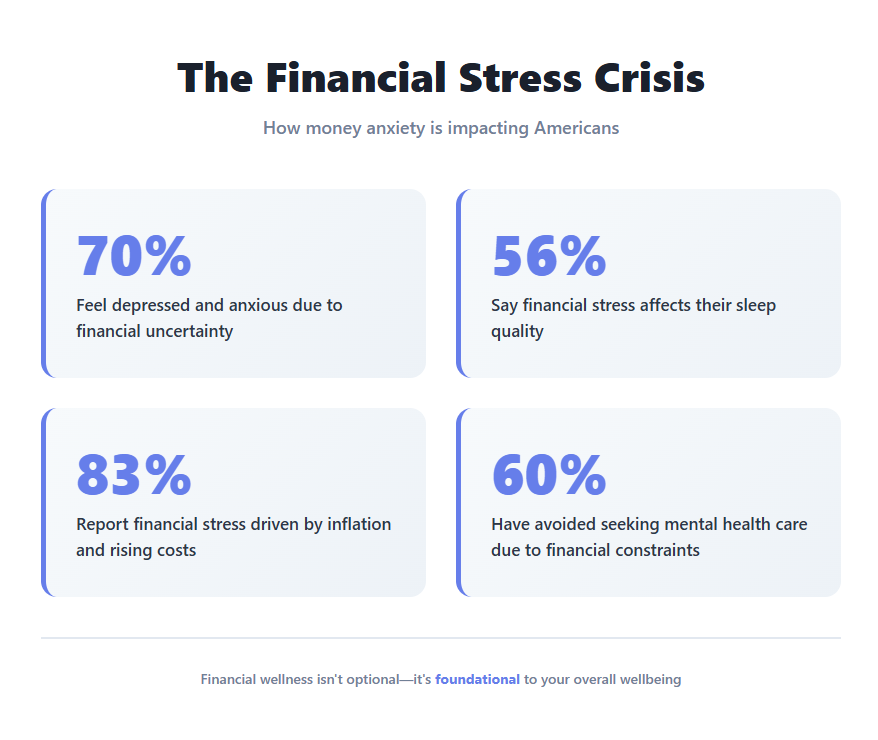
Money is the leading factor negatively affecting Americans' mental health, ahead of politics, world news, climate change, and even physical health concerns.4 Let that sink in for a moment.
The statistics paint a sobering picture:
Nearly 70% of Americans say financial uncertainty has made them feel depressed and anxious, an 8-percentage point increase from just two years ago 9
Over 50% of Americans feel stressed or anxious about their finances multiple times per week, with overall financial stress intensity rated at 3.2 out of 5 2
83% of Americans report financial stress driven by inflation, rising living costs, and recession concerns7
56% say financial stress affects their sleep, 55% their mental health, 50% their self-esteem, 44% their physical health, and 40% their relationships at home 5
Perhaps most troubling: 60% of people have avoided seeking mental health care due to financial constraints. 7 The very stress that's damaging their wellbeing prevents them from getting help.
This isn't just about feeling worried. Nearly 4 in 10 Gen Z and Millennials report feeling depressed and anxious on at least a weekly basis due to financial uncertainty. 9 Financial stress has become a chronic condition, one that compounds over time if left untreated.
Why Financial Wellness Gets Left Behind
You probably wouldn't hesitate to invest in a gym membership, therapy, or organic groceries. These feel productive, healthy, empowering (right?). But financial planning? Why does that feel overwhelming, complicated, shameful, or uncomfortable?
Here's the reality: We often learn our money mindset from our families. You likely absorbed attitudes, fears, and behaviors about money long before you understood what money actually was. Many of those patterns may not be serving you anymore, but they could still be running in the background, influencing your financial decisions. (These are sometimes called "money scripts," a whole topic we could explore another time.)
And unlike organizing your closet or meal prepping for the week, you may not see the results of financial planning immediately. There's no before-and-after photo. No dopamine hit from a perfectly labeled container.
That's probably why only 48% of Americans have emergency funds that would cover three months of expenses, even though this is considered the baseline for financial security.3 It may also explain why nearly 1 in 4 households lived paycheck to paycheck in 2025, despite total household debt reaching $18.59 trillion.6
What True Financial Wellness Actually Looks Like
Financial wellness isn't about making as much money as possible. It's about using money as a tool to make your overall life better.
It means:
Financial security - The ability to handle an emergency without panic
Strategic debt management - A manageable debt load skewed toward "good" debt like a mortgage, not high-interest credit cards crushing your monthly budget
Aligned spending - Money flowing to the right places at the right times, supporting what matters most to you
Freedom from anxiety - Confidence that you're making sound decisions, not constant worry about what you might be missing
This isn't about restriction. It's about abundance. Making conscious choices that create the life you actually want to live.
The Money Mindset Shift That Changes Everything
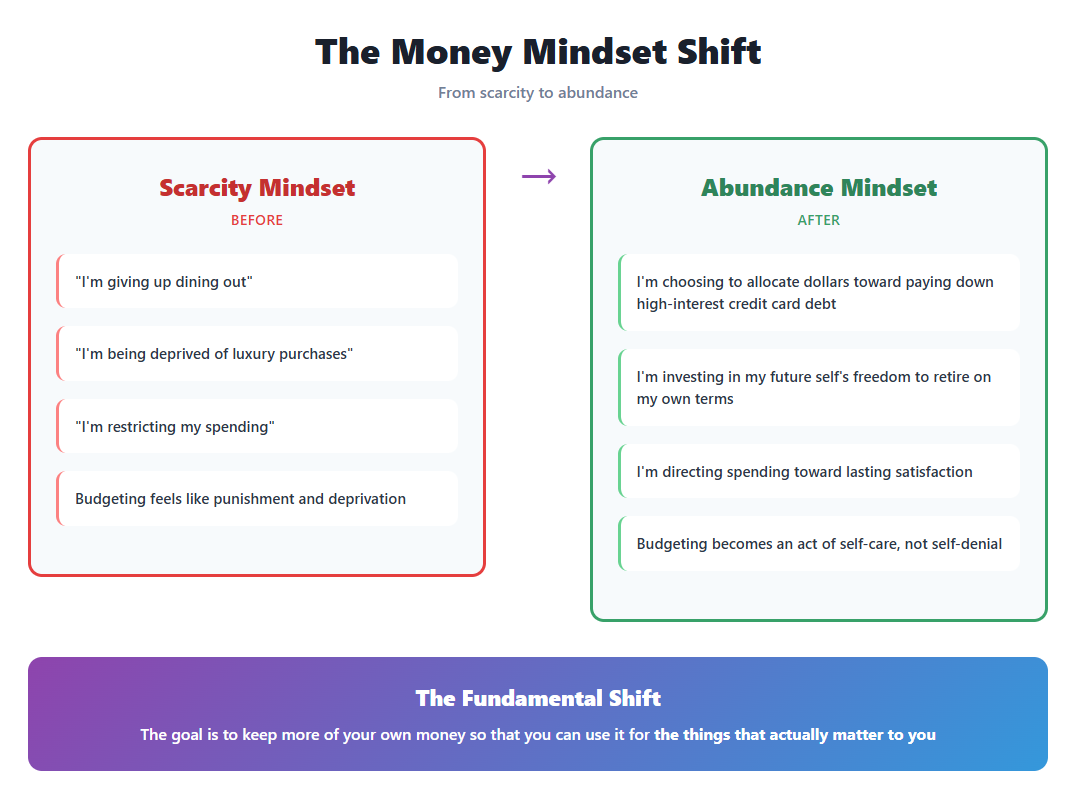
Most people approach budgeting as punishment. A list of things they can't have. A constant reminder of scarcity.
But here's the reframe: Your goal is to spend as much of your money as possible over the course of your life (on the things that actually matter to you).
Budgeting, saving, and investing are simply techniques to smooth out spending across earning years and non-earning years. The purpose isn't deprivation, it's ensuring your lifestyle remains at the level you want, both now and in retirement, while avoiding the trap of high-interest debt that can sabotage your financial future.
This shift from scarcity to abundance mindset transforms everything:
You're not "giving up" dining out. You're choosing to allocate those dollars toward paying down that 21% credit card balance6that's costing you thousands in interest
You're not being "deprived" of luxury purchases. You're investing in your future self's freedom—whether that's eliminating debt, taking a sabbatical, or retiring early
You're not "restricting" your spending. You're directing it toward what brings you lasting satisfaction instead of fleeting dopamine hits that often end up on high-interest credit cards
When you understand this, budgeting becomes an act of self-care, not self-denial.
Breaking the Silence: Why Talking About Money Matters
Money remains one of our last cultural taboos. We'll discuss our relationships, our therapy sessions, our trauma, but our credit card debt? Our salary? Our fear that we're falling behind? Those topics remain off-limits.
This silence keeps you stuck.
The majority of people whose mental health is negatively impacted by money cite inflation and rising prices as the culprit 4, but they're likely suffering alone, convinced everyone else has it figured out.
In relationships, financial silence is toxic. Shame over debt or unequal wealth sabotages progress toward shared goals. One partner quietly panics while the other remains oblivious. Resentment builds. Trust erodes. (An objective third party could help navigate these conversations, right?)
In friend groups, financial transparency creates both reassurance and knowledge. How did they handle that situation? What professionals helped them? What strategies actually worked? This information is invaluable, but only if people are willing to share it.
The irony? 78% of Gen Z say financial responsibility is an important attribute when choosing a significant other, and 66% don't feel pressured by friends to spend beyond their means.8 The younger generation is already normalizing these conversations. It's time the rest of us catch up.
The Six Pillars You Can't Afford to Ignore
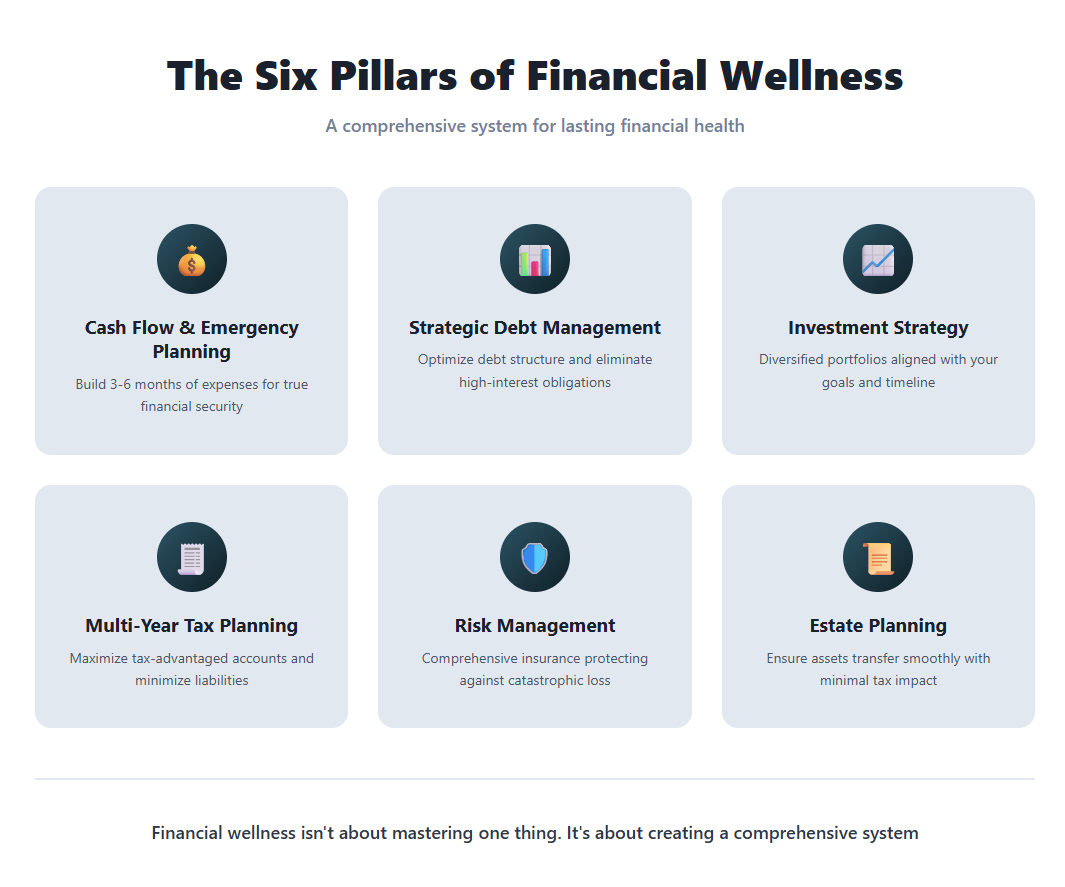
Financial wellness isn't about mastering one thing. It's about creating a comprehensive system across six critical areas:
1. Cash Flow & Emergency Planning
Beyond just "spending less than you earn," this means understanding your patterns, optimizing your savings rate, and maintaining 3-6 months of living expenses for true emergencies. Only 20% of lower-income adults report being in excellent or good financial shape currently, 1 but this isn't about income level. It's about having a plan.
2. Strategic Debt Management
The average credit card interest rate crossed 21% in 2025, making high-interest debt incredibly expensive.6 Should you consolidate? Pay down aggressively? Use a home equity loan? The answers depend on your specific situation and goals.
3. Investment Strategy
Your portfolio should reflect your timeline, goals, and risk tolerance, not last quarter's hot stock. Are you properly diversified? Are tax implications part of your strategy? Research from major financial institutions consistently shows that diversification across asset classes reduces portfolio volatility and risk without necessarily sacrificing returns.12
4. Multi-Year Tax Planning
This isn't about filing your return. It's about maximizing tax-advantaged accounts, planning for retirement distributions, and, if you're a business owner, structuring your affairs for maximum efficiency. While the tax code is complex, strategic planning could help optimize your tax situation.
5. Comprehensive Risk Management
Health insurance, life insurance, disability coverage, umbrella policies, and long-term care: each serves a different purpose. 27% of adults had trouble paying for medical care in the past year.3 The right insurance protects you from catastrophic financial loss.
6. Estate Planning
Who cares for your children if something happens to you? Who makes healthcare decisions? How do your assets transfer, and what are the tax implications? These aren't comfortable conversations, but they're essential ones.
Why Going It Alone Isn't Working
You likely know much of this intellectually. You probably understand you should have a budget, pay down debt, invest for retirement, get proper insurance, and create an estate plan.
But here's what the research shows about people who try to do it themselves:
They make expensive mistakes. Behavioral mistakes may reduce wealth significantly.15 Common errors include market timing, panic selling during downturns, chasing performance, and failing to rebalance portfolios systematically.
They let emotions drive decisions. Behavioral mistakes may reduce wealth significantly.15 When markets drop, panic sets in. When they soar, greed takes over. Both can undermine long-term returns.
They don't know what they don't know. Tax strategies, estate planning nuances, insurance gaps, investment allocation. These are complex domains where missteps can have long-term consequences.
They run out of time and energy. U.S. employees 56% spend 3 or more work hours per week dealing with personal financial issues.5
The Measurable Value of Professional Guidance
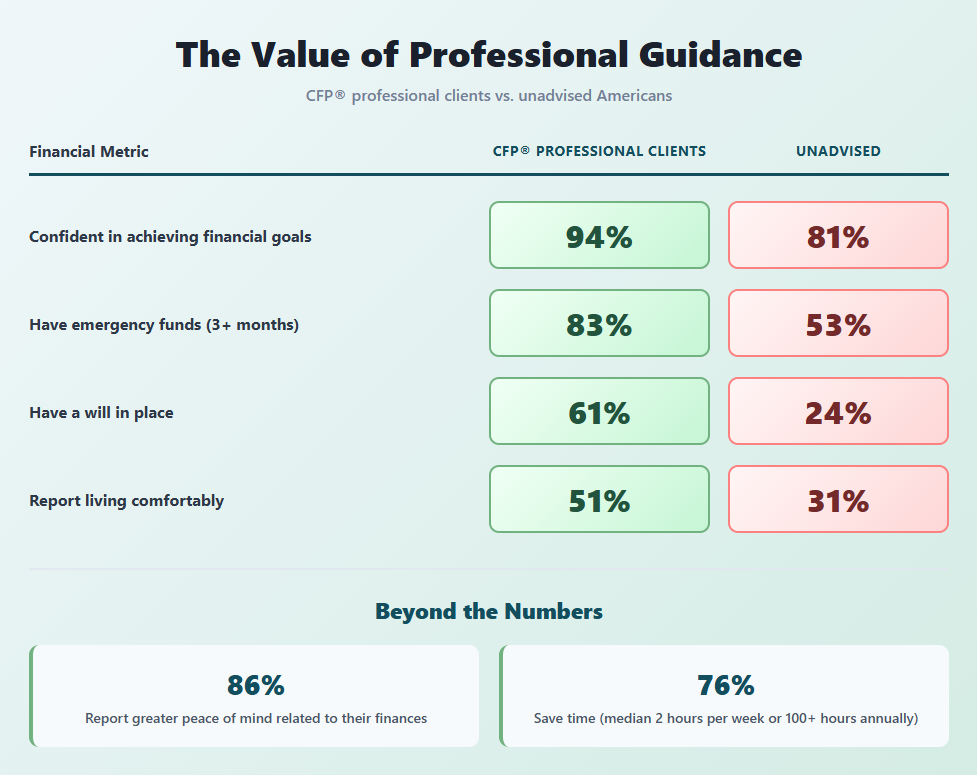
The financial advice industry has been rigorously studied. The data is clear and consistent:
Leading research from Vanguard, Morningstar, and Russell Investments has examined the potential value professional advisors may add through their "Advisor's Alpha" and "Gamma" frameworks.10,17,13These studies explore how tax optimization, behavioral coaching, strategic asset location, disciplined rebalancing, and comprehensive planning could contribute meaningful value over time by supporting better decision-making and helping clients avoid costly mistakes.
Beyond portfolio optimization:
94% of households advised by CFP® professionals feel confident in their ability to achieve their financial goals, compared to 85% of those working with other advisors and 81% of unadvised Americans.11
CFP® professional clients are significantly more prepared: 83% maintain emergency funds covering three months of expenses (versus 68% with other advisors and 53% unadvised), and 61% have a will in place (versus 46% with other advisors and 24% unadvised).11
Half (51%) of people who work with a CFP® professional report living comfortably, compared to 40% with other advisors and 31% of unadvised households.11
Advised investors report greater peace of mind related to their finances: 86% feel more peace of mind, with 60% experiencing less anxiety, worry, sadness, and disappointment, and instead feeling more confident, satisfied, secure, and proud.16
Working with an advisor may also save time: 76% report time savings, with a median of two hours per week (over 100 hours annually) that can be redirected toward activities like leisure, time with family, and exercise.16
The Emotional ROI You Can't Ignore
Over half of consumers who work with CFP® professionals report that financial advice positively impacted their mental health and family life.11 Given the financial stress we discussed earlier, consider what addressing it might mean: the potential for better sleep, less anxiety, improved relationships, greater confidence, and more time with your family.
Research also shows that clients of CFP® professionals report higher quality of life scores compared to those who work with other financial planning professionals or manage finances independently.11 Investors with human advisors perceive meaningful progress toward their financial goals compared to managing finances on their own.14
This isn't just about money. It's about reclaiming your mental bandwidth, your emotional energy, and your time.
Can you quantify peace of mind? Can you put a price on knowing you've made sound decisions that keep your goals on track? Can you measure the value of not lying awake at 3 AM worrying about money?
The Real Cost of Waiting
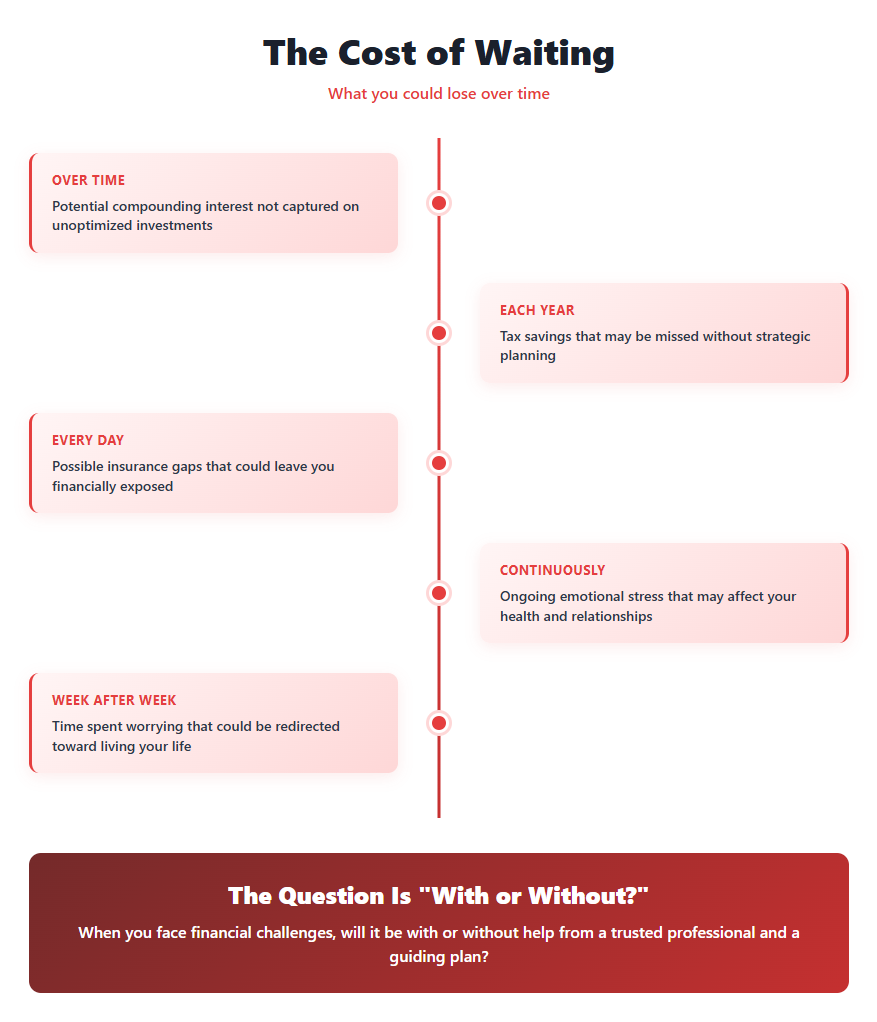
Each month without a comprehensive financial plan may mean:
Potential compounding interest not captured
Tax savings that may be missed
Possible insurance gaps that could leave you exposed
Ongoing emotional stress that may affect your health and relationships
Time spent worrying that could be redirected toward living your life
Near the end of 2024, only 73% of adults reported doing okay financially or living comfortably, down from 78% in 2021.1 The trend suggests challenges for many Americans.
Meanwhile, 28% of adults expect their financial situation to be worse a year from now, up significantly from 16% who said this in 2024.3
The environment presents ongoing challenges: inflation, rising costs, economic uncertainty. The question is whether you'll face them with a plan or without one.
What Makes Financial Wellness Different From Every Other Form of Organization
When you organize your closet, you feel satisfied for a few weeks. Then life happens, and you're back to chaos.
When you establish financial wellness with a competent advisor, you create a system that:
Compounds over time with ongoing adjustments rather than constant upkeep
Adapts to your life instead of becoming obsolete
Streamlines future decisions rather than adding complexity
Builds on itself instead of needing to start from scratch
A good financial advisor should quarterback your entire financial life, not just help you create a budget. This means coordinating your investments, taxes, insurance, and estate plan. Working with your CPA and attorney to ensure nothing falls through the cracks. Monitoring and adjusting as markets change, laws change, and your life changes.
If your current advisor isn't providing this level of comprehensive guidance, it may be worth considering whether you're getting the value you deserve.
Most importantly, the right advisor should transform financial planning from a source of anxiety into a source of confidence.
From Overwhelmed to In Control: What Working Together Looks Like
If you're thinking, "I need to do something about this," here's what taking action actually involves:
Step 1: An Honest Conversation
No judgment, no sales pressure. Just a candid discussion about where you are, where you want to be, and what's standing in your way. Many people find this conversation provides helpful clarity as a starting point.
Step 2: Comprehensive Assessment
We examine all six pillars of financial wellness together. Where are the opportunities? Where are the vulnerabilities? What's working, and what's quietly undermining your goals?
Step 3: Your Customized Plan
Not a template. Not generic advice. A written financial plan that addresses your specific circumstances, values, and goals, with clear action steps and realistic timelines.
Step 4: Implementation & Ongoing Partnership
You don't get a binder to put on a shelf. Your advisor helps you execute the plan, automate what can be automated, and adapt as your life evolves (by the way, this is how I work with clients). Regular check-ins ensure you stay on track and adjust course when needed.
This is what financial wellness actually looks like: not perfect budgets that fail after two weeks, but sustainable systems that support the life you want to live.
The Bottom Line: Financial Wellness Is Wellness
You can't exercise your way out of financial stress. You can't hydrate your way to retirement security. You can't sleep your way to financial freedom (especially if you're stressed about your finances 5). And ignoring it won't make it disappear.
Physical health, mental health, and financial health are interconnected. 73% of clients who work with CFP® professionals generally feel they can cope well with any health issues compared to 64% of unadvised consumers.11 Financial wellness doesn't just reduce money stress: it makes you more resilient across all areas of life.
The cultural narrative tells you that needing help with money is a sign of failure. That's backwards.
You wouldn't think twice about hiring a trainer to optimize your physical health or a therapist to support your mental health. Your financial health deserves the same level of professional attention, especially since it impacts other dimensions of your wellbeing.
Your Next Step
Financial wellness isn't about having definitive answers. It's about asking the right questions and working with someone who can help you find answers that fit your life.
The choice isn't between managing everything yourself or delegating everything to someone else. It's between struggling alone with uncertainty or partnering with a professional who can provide clarity, strategy, and peace of mind.
Ready to make financial wellness part of your overall wellbeing?
Schedule your complimentary financial wellness consultation (below)
Let's transform financial stress into financial confidence, together.
Sources and References
Federal Reserve. (2025). Report on the Economic Well-Being of U.S. Households in 2024. https://www.federalreserve.gov/publications/2025-economic-well-being-of-us-households-in-2024-overall-financial-well-being.htm
Motley Fool Money. (2024). Financial Stress, Anxiety, and Mental Health Survey. https://www.fool.com/money/research/financial-stress-anxiety-and-mental-health-survey/
Pew Research Center. (2025). More Americans now say personal finances will be worse a year from now. https://www.pewresearch.org/short-reads/2025/05/07/growing-share-of-us-adults-say-their-personal-finances-will-be-worse-a-year-from-now/
Bankrate. (2025). Money and Mental Health Survey. https://www.bankrate.com/banking/money-and-mental-health-survey/
PwC. (2023). Employee Financial Wellness Survey. https://www.pwc.com/us/en/services/consulting/business-transformation/library/employee-financial-wellness-survey.html
CoinLaw. (2025). Household Financial Stress Statistics 2025. https://coinlaw.io/household-financial-stress-statistics/
LifeStance Health. (2025). 2025 Study: How Financial Stress ("Stressflation") Impacts Americans' Mental Health. https://lifestance.com/insight/financial-stress-impact-mental-health-statistics-2025/
Bank of America. (2025). Better Money Habits Financial Education Study. https://newsroom.bankofamerica.com/content/newsroom/press-releases/2025/07/confronted-with-higher-living-costs--72--of-young-adults-take-ac.html
Northwestern Mutual. (2025). Planning & Progress Study. https://news.northwesternmutual.com/2025-06-03-Nearly-70-of-Americans-Say-Financial-Uncertainty-Has-Made-Them-Feel-Depressed-and-Anxious,-According-to-Northwestern-Mutual-2025-Planning-Progress-Study
Vanguard. Putting a Value on Your Value: Quantifying Vanguard Advisor's Alpha. https://advisors.vanguard.com/advisors-alpha
CFP Board. (2026). Trust. Confidence. Impact: 2025 Financial Planning Longitudinal Study. https://www.cfp.net/news/2026/01/cfp-professional-advised-americans-experience-greater-financial-preparedness
Vanguard. Framework for Constructing Globally Diversified Portfolios. https://investor.vanguard.com/investor-resources-education/portfolio-management/diversifying-your-portfolio
Russell Investments. Value of an Advisor Study. Referenced in multiple industry analyses of advisor value-add through holistic financial planning.
Vanguard. Why Clients Prefer Financial Advisors Over Robo Advisors. https://advisors.vanguard.com/advisors-alpha/advice-that-clients-value
Covenant Wealth Advisors. (2025). The True Value of a Financial Advisor: What You Need to Know. https://www.covenantwealthadvisors.com/post/value-of-a-financial-advisor-what-you-need-to-know
Vanguard. (2025). Advice Pays in Peace of Mind and Time. https://corporate.vanguard.com/content/corporatesite/us/en/corp/who-we-are/pressroom/press-release-advice-pays-in-peace-of-mind-and-time-vanguard-survey-reveals-hidden-value-of-financial-advice-07072025.html
Blanchett, D. and Kaplan, P. (2013). Alpha, Beta, and Now...Gamma. Morningstar. https://www.morningstar.com/financial-advisors/gamma-action
Certified Financial Planner Board of Standards, Inc. (CFP Board) owns the CFP® certification mark in the United States, which it authorizes use of by individuals who successfully complete CFP Board's initial and ongoing certification requirements.