
Market Commentary: Midyear 2026
Four Themes Shaping the First Half of 2026

In the first half of 2026, there was plenty of news, but a few different themes in particular stand out to me: a war in the Middle East that unsettled energy markets for months, a new Federal Reserve chair who took a more cautious stance than expected (given the current administration’s pressure), and growing scrutiny of the artificial intelligence (AI) theme that has driven so much of the market's recent gains, both in how AI is being used inside companies and how AI-related revenue is being generated among the largest technology firms.
Through it all, the Standard & Poor's 500 (S&P 500) finished the first half up 10.21% on a price basis[1], a number that hides how uneven the path to get there actually was. This commentary walks through these threads that influenced the first six months of the year and may continue to shape the second.
Federal Reserve and Interest Rates
Jerome Powell's term as Fed chair ended on May 15. Kevin Warsh, confirmed by the Senate in a 54-45 vote, was sworn in on May 22.[2] He was widely viewed as the more rate-cut-friendly, reform-minded choice, having criticized the Fed's communication habits, argued for a smaller balance sheet, and suggested AI would help bring inflation down over time[3]. Though it's notable that Powell remains on the board as a voting member, a dynamic that adds another layer of uncertainty to how policy debates may unfold in the second half.
On June 17, the Federal Open Market Committee (FOMC) held rates steady at 3.50% to 3.75% for a fourth consecutive meeting. Warsh shortened the post-meeting statement, removed language signaling the Fed's future intentions, and declined to submit his own interest rate forecast, consistent with his stated skepticism of the exercise.[4] The other eighteen participants, however, leaned more strongly toward keeping rates higher than expected, with several now projecting at least one rate hike by year-end, a reversal from the rate cut the median projection had implied as recently as March.[5] The reasoning: inflation has proven stickier than hoped, with the Consumer Price Index (CPI) running 3.8% year over year in April, the highest since 2023, and the core Personal Consumption Expenditures (PCE) index, the Fed's preferred inflation gauge, moving from 3.0% to 3.3% over the same stretch.[6] (This is still nowhere near the 9.1% peak CPI hit in June 2022, the highest reading in roughly 40 years, which triggered the Fed to raise rates from near zero to over 5% in just about a year and a half.[22]) Energy prices tied to the Iran war are a sizable part of that story, layered on top of a labor market still adding jobs at a pace that gives the Fed little urgency to ease.
A practical note for rate watchers: for those who have been waiting on a rate drop to refinance and lower your monthly payment, that wait could run longer than expected. A mortgage recast is an option for anyone sitting on a lump sum in the interim, since it doesn't depend on rates moving at all. It keeps your existing rate and loan term but applies a sizable principal payment to the balance, then recalculates the monthly payment based on what's left owed, all without the appraisal, credit check, or closing costs of a full refinance. It's typically only available on conventional loans and usually carries a modest processing fee.
Middle East Conflict and Market Impact
On February 28, the United States and Israel launched a joint operation against Iran that killed Supreme Leader Ali Khamenei and opened a regional war that also reignited the Israel-Hezbollah conflict in Lebanon.[7] Iran responded in part by closing the Strait of Hormuz, the waterway carrying roughly 20% of the world's seaborne oil and liquefied natural gas (LNG). Shipping traffic fell more than 90% in the weeks that followed.[8]
Energy markets bore the brunt of it. Brent crude jumped from about $71 to $77 a barrel within days of the first strikes, eventually breaking $100, while West Texas Intermediate (WTI) crude peaked near $113 in April. By mid-June, prices had retreated toward the high $70s as ceasefire talks progressed, though Hormuz traffic still has not returned to pre-war levels, and full normalization isn't expected until 2027 even under an optimistic scenario.[9]
Equity markets moved in step with the headlines, selling off through much of March as the conflict widened, then surging when a ceasefire was first announced on April 8, with the Dow gaining over 1,300 points and the S&P 500 up 2.5% that day alone.[10] The United States and Iran signed an agreement on June 17 that paused large-scale hostilities, but it has been tested repeatedly since: a drone strike on a cargo ship on June 25, a U.S. response the next day, Iranian missiles and drones aimed at U.S. bases in Kuwait and Bahrain, and a second ship hit and a second night of U.S. strikes on June 27.[11]
This is the second time in just over a year that an Iran-related conflict has rattled markets, which makes it a useful moment to revisit how markets have historically absorbed military shocks. The two charts illustrate the longer-term picture.
In addition to the charts shown from JP Morgan and Dimensional Fund Advisors, research from LPL and Hartford Funds, looking across dozens of post-World War II shocks, finds an average decline of roughly 5% following a geopolitical event, with markets typically bottoming within about three weeks and recovering within one to two months, and the S&P 500 historically higher a year out about 70% of the time. J.P. Morgan's research group found a similar pattern across seventeen modern conflicts dating back to the Korean War: the S&P 500 sat modestly below its pre-conflict level a year out, then stood roughly 14% above the conflict-month level two years later.[12] The 2026 episode has tracked that pattern reasonably well so far, even though the International Energy Agency has described the disruption to oil markets as the largest in the industry's history.[13]
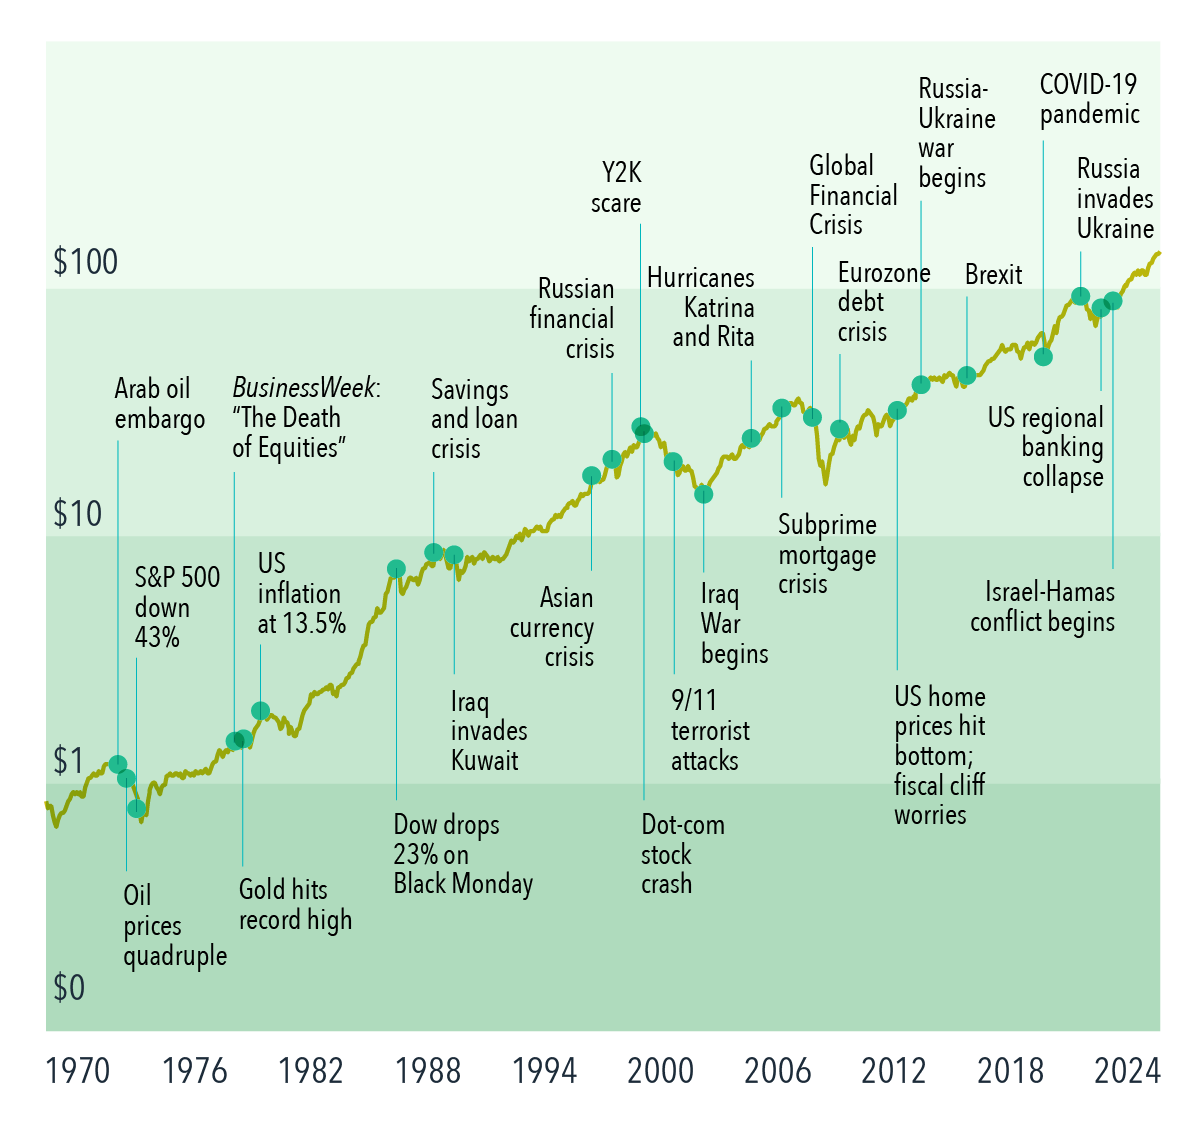

S&P 500 around military conflicts (month of event = 100)
Artificial Intelligence and Productivity
A widely discussed report from Glean, the Work AI Index 2026, surfaced interesting findings. By the survey's count, 87% of knowledge workers now use AI at work, 73% say it makes them more productive, and the average reported time savings comes to 13 hours a week. Those are individual self-assessments, however. When it comes to actual organizational outcomes, only 13% of those same workers say their organization is performing better as a result, suggesting that individual time savings are not automatically translating into measurable business improvements.[14] Glean's head of Work Innovation, Rebecca Hinds, has a name for part of the gap: “bot sitting,” the roughly 6.4 hours a week employees spend feeding context to AI systems, correcting their output, and cleaning up after them, invisible labor that eats into the time AI was supposed to free up. Sixty-nine percent of workers admit they have shipped AI-generated work they could not explain or defend if asked, a pattern the report labels “bot slop.”[15]
The dynamic is showing up in corporate budgets, too. Uber reportedly exhausted its 2026 AI tools budget well ahead of schedule due to higher than anticipated costs, and one technology executive noted that at some companies, the cost of the compute now runs ahead of the cost of the employees it was meant to support.[16] For investors, the relevant question isn't whether AI tools are useful; it's whether the productivity gains baked into AI-related earnings and capital spending assumptions are translating as cleanly as advertised. If a sizable share of “time saved” is being reallocated to managing the tools rather than higher-value work, the payback period on enterprise AI spending may run longer, and less predictably, than current stock market valuations assume.
AI Earnings Concentration Risk
A small group of companies, Nvidia, Microsoft, OpenAI, Oracle, Advanced Micro Devices (AMD), and CoreWeave among them, have built an increasingly interconnected web of investments and purchase commitments, where a sizable share of one company's revenue traces back to another company's investment in it.[17] Nvidia has committed up to $100 billion to OpenAI, which in turn uses Nvidia chips to build out data centers. Microsoft's roughly $13 billion stake in OpenAI has been delivered largely as Azure cloud credit, which OpenAI spends back with Microsoft. Oracle's $300 billion infrastructure agreement with OpenAI is filled mostly with Nvidia hardware, and Nvidia holds a stake in CoreWeave while supplying it chips, even as OpenAI holds its own stake in CoreWeave while buying its cloud capacity.[18]
Supporters call this a strategic necessity given how capital-intensive AI infrastructure has become and how scarce advanced chips remain.[19] Critics see something closer to the vendor financing arrangements of the dot-com era, in which companies effectively funded their own customers' purchases to inflate the appearance of organic demand. Investor Michael Burry, whose early, contrarian bet against the 2008 housing market was dramatized in the film The Big Short (one of my favorites if you haven't seen it), began shorting Nvidia and Palantir in late 2025 on similar grounds, and reiterated the comparison again in May.[20] Tech sector bond issuance reached roughly $428 billion in 2025, the cost of insuring against default by Oracle and Microsoft has nearly doubled since last fall, and Goldman Sachs recently raised its 2026 AI capital spending estimate to about $527 billion.[21] Whether this amounts to a bubble likely comes down to whether external, organic demand for AI products catches up to the revenue being generated inside this closed loop. If it does, the arrangement looks like ordinary supply chain financing. If it doesn't, the unwind could be sharp, given how concentrated these companies have become within major indexes.
Index Returns
Index / Indicator YTD Returns Through 6/30/2026
S&P 500 Index +10.21%
Russell 2000 Index (small caps) +22.57%
MSCI All Country World ex USA (international stocks) +13.05%
MSCI Emerging Markets Index +23.85%
Bloomberg U.S. Aggregate Bond Index +1.15%
Bloomberg Municipal Bond Index +2.32%
Dow Jones Global Select REIT Index (real estate) +13.32%
Index returns sourced from Dimensional Fund Advisors Periodic Performance Report, 1/1/2026 – 6/30/2026.
Treasury Yields as of July 1, 2026
Yields (as of 7/1/2026)
Fed Funds Target Rate 3.75%
3-Month Treasury 3.85%
6-Month Treasury 4.00%
2-Year Treasury 4.17%
5-Year Treasury 4.24%
10-Year Treasury 4.48%
30-Year Treasury 4.97%
Treasury yields sourced from U.S. Department of the Treasury via Charles Schwab, as of July 1, 2026. Index returns are for illustrative purposes and do not reflect the returns of any actual investment. Past performance is not indicative of future results.
The S&P 500 finished the first half of the year up 10.21%, but the broader return picture tells a more interesting story. Emerging markets (+23.85%), small-cap U.S. stocks via the Russell 2000 (+22.57%), and international developed stocks (+13.05%) all outpaced the S&P 500 by a wide margin, a theme covered in more depth in my recent article, Is the S&P 500 Really All You Need?. Bonds were positive but modest, with the Bloomberg U.S. Aggregate returning 1.15%. On the yield side, the 2-year Treasury at 4.17% sitting above the Fed Funds rate of 3.75%, and the 30-year rate approaching 5% signals a more normal-looking yield curve compared to recent years, when shorter-term rates were running even with or above long-term rates.
Portfolio Considerations
None of these stories are reason for alarm for a diversified investor, nor are they the whole story (I didn’t even touch on SpaceX's record IPO, which the initial stock prices arguably imply that its newer AI and computing bets pay off years down the line.) However, they raise a few questions worth considering:
1. How much of my equity exposure rides on a small number of mega-cap technology companies, and am I comfortable with that level of concentration if AI-related earnings growth slows?
2. Does my fixed income allocation account for a higher-for-longer, and possibly higher-still, rate environment, rather than the rate cuts that looked likely at the start of the year?
3. Has my time horizon or risk tolerance shifted in a way my portfolio hasn't caught up to yet?
4. If markets got bumpy over the next year or two, do I have enough in liquid reserves (keeping in mind that a diversified fixed income allocation can serve as a longer-term buffer) that I wouldn’t need to sell equity holdings to cover an unexpected expense or income disruption?
These are exactly the kinds of questions to work through together, in the context of a full financial picture rather than headline by headline.
Sources
Dimensional Fund Advisors, Periodic Performance Report, Monthly: 1/1/2026 – 6/30/2026, as of June 30, 2026. Index returns are for illustrative purposes and do not reflect the performance of any actual investment.
NPR, “Senate confirms Kevin Warsh as next chair of the Federal Reserve,” May 13, 2026; Federal Reserve Board press release, May 15, 2026; Brookings, “Who has to leave the Federal Reserve next?”
CNN Business, “Kevin Warsh nominated by Trump to be the next Federal Reserve chair,” January 30, 2026; CCN, “Kevin Warsh Officially Replaces Fed Chair Jerome Powell,” May 17, 2026.
CNBC, “Fed interest rate decision June 2026: Fed holds rates steady,” June 17, 2026; Lord Abbett, “June Fed Meeting: Policy Signals from the New Chairman.”
Lord Abbett, June 2026 FOMC analysis; Bondsavvy, “June 2026 Fed Dot Plot: What It Means for Money Market Yields.”
Polymarket, “Fed Decision in June? Trading Odds & Predictions 2026”; U.S. Bank, “Fed holds rates steady as new Chair Kevin Warsh commits to price stability.”
LPL Research and Hartford Funds historical analyses, as summarized in Focus Partners Wealth, “Geopolitical Conflict and Markets: A Brief History Lesson”; J.P. Morgan Wealth Management, “Crisis in the Middle East: Assessing Potential Market Impacts,” jpmorgan.com.
House of Commons Library, “Israel/US-Iran conflict 2026: Reopening the Strait of Hormuz”; Congressional Research Service, R45281.
CNBC, “Oil prices turn lower as U.S.-Iran ceasefire extension awaits Trump approval,” May 28, 2026; CNBC, “Oil drops 20% from 2026 peak,” May 29, 2026; House of Commons Library, op. cit.
NBC News, “Iran war ceasefire sends oil prices tumbling and stocks soaring,” April 9, 2026.
CBS News, “U.S. strikes targets in Iran after Iranian drone attack on cargo ship,” June 26, 2026; Al Jazeera, “US launches second night of strikes on Iran after ship hit by drone,” June 27, 2026; NPR, “U.S. strikes multiple targets in Iran in response to tanker attack,” June 27, 2026; CNN, “US launches more strikes on Iranian sites,” June 27, 2026.
Wikipedia, “Economic impact of the 2026 Iran war,” citing International Energy Agency characterization; Seeking Alpha, “Since 1953 This Is How The S&P 500 Has Performed After A Major Geopolitical Shock,” April 2026. Britannica, “2026 Iran war”; Wikipedia, “2026 Iran war.”
Glean, Work AI Index 2026, as discussed by Rebecca Hinds on The Cognitive Revolution; summarized in Biggo Finance, “Rebecca Hinds on the 13-Hour AI Lie.”
Ibid.
Fortune, “The AI economy could crash on mounting chip costs,” May 30, 2026.
Bloomberg, “AI Circular Deals: How Microsoft, OpenAI and Nvidia Keep Paying Each Other,” March 11, 2026; Wikipedia, “AI bubble.”
CraftedCharts, “AI Circular Financing: Nvidia, Microsoft & OpenAI”; Noah Smith, “Should we worry about AI's circular deals?”; Global Finance Magazine, “AI's Financial Circle Game.”
Noah Smith, op. cit.; Global Finance Magazine, op. cit.
Wikipedia, “AI bubble”; Global Finance Magazine, op. cit.
Investing.com, “2026: Another Year of AI Bubble Not Bursting?”; Fortune, op. cit.
U.S. Bureau of Labor Statistics, “Consumer prices up 9.1 percent over the year ended June 2022, largest increase in 40 years,” The Economics Daily, July 13, 2022, bls.gov.
Disclosures
Fiduciary Financial Advisors does not accept any liability for the use of the information discussed. Consult with a qualified financial, legal, or tax professional prior to taking any action. Before investing, consider investment objectives, risks, fees, and expenses. Investments in securities involve the risk of loss, including loss of principal. Past performance is no guarantee of future returns. The views and opinions reflected in the content are subject to change at any time without notice. The content speaks only as of the date indicated. Some information was obtained from external sources. The information is believed to be accurate, but there is no guarantee that it is.
This commentary is for informational purposes only and does not constitute investment, tax, or legal advice. The views expressed reflect current conditions and are subject to change without notice.
Fiduciary Financial Advisors is a Registered Investment Adviser. Past performance is not indicative of future results, and there is no guarantee that any forecast or projection discussed will come to pass. Third-party data referenced above has not been independently verified by Fiduciary Financial Advisors.
CFP® and Certified Financial Planner® are certification marks owned by the Certified Financial Planner Board of Standards, Inc., and are awarded to individuals who meet its education, examination, experience, and ethics requirements.